Exam 16: The Influence of Monetary and Fiscal Policy on Aggregate Demand
Exam 1: Ten Principles of Economics439 Questions
Exam 2: Thinking Like an Economist615 Questions
Exam 3: Interdependence and the Gains From Trade527 Questions
Exam 4: The Market Forces of Supply and Demand697 Questions
Exam 5: Measuring a Nations Income518 Questions
Exam 6: Measuring the Cost of Living543 Questions
Exam 7: Production and Growth507 Questions
Exam 8: Saving, Investment, and the Financial System565 Questions
Exam 9: The Basic Tools of Finance510 Questions
Exam 10: Unemployment and Its Natural Rate698 Questions
Exam 11: The Monetary System517 Questions
Exam 12: Money Growth and Inflation484 Questions
Exam 13: Open-Economy Macroeconomics: Basic Concepts520 Questions
Exam 14: A Macroeconomic Theory of the Open Economy478 Questions
Exam 15: Aggregate Demand and Aggregate Supply563 Questions
Exam 16: The Influence of Monetary and Fiscal Policy on Aggregate Demand510 Questions
Exam 17: The Short-Run Tradeoff Between Inflation and Unemployment516 Questions
Exam 18: Six Debates Over Macroeconomic Policy372 Questions
Select questions type
Which of the effects listed below increases the quantity of goods and services demanded when the price level falls and decreases the quantity of goods and services demanded when the price level rises?
Free
(Multiple Choice)
4.7/5  (44)
(44)
Correct Answer: Verified
D
In 2009 President Obama and Congress increased government spending. Some economists thought this increase would have little effect on output. Which of the following would make the effect of an increase in government expenditures on aggregate demand smaller?
Free
(Multiple Choice)
4.9/5 (45)
Correct Answer:Verified
B
A decrease in government spending initially and primarily shifts
Free
(Multiple Choice)
4.8/5 (33)
Correct Answer:Verified
B
Policymakers use _____ policy and _____ policy to stabilize _____ and _____ in the short run.
(Short Answer)
4.9/5 (36)
Figure 34-2. On the left-hand graph, MS represents the supply of money and MD represents the demand for money; on the right-hand graph, AD represents aggregate demand. The usual quantities are measured along the axes of both graphs.
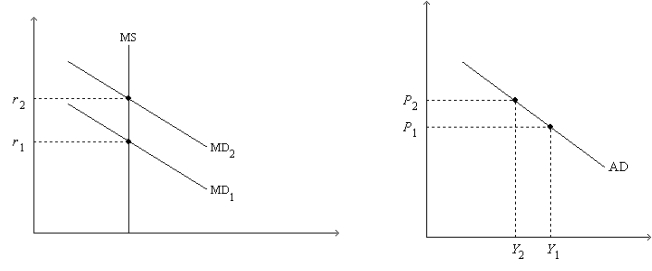 -Refer to Figure 34-2. Assume the money market is always in equilibrium. Under the assumptions of the model,
(Multiple Choice)
4.7/5 (37)
Which of the following sequences best explains the negative slope of the aggregate-demand curve?
(Multiple Choice)
4.7/5 (32)
Figure 34-8 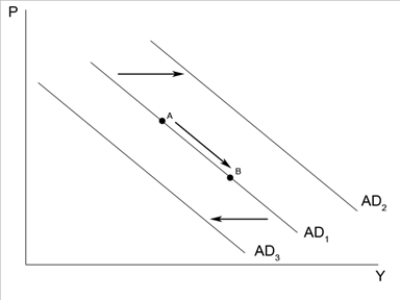 -Refer to Figure 34-8. An increase in government purchases will
(Multiple Choice)
4.9/5 (36)
To offset increased pessimism by households, the government may _____ government spending and/or _____ taxes.
(Short Answer)
4.7/5 (36)
Figure 34-1 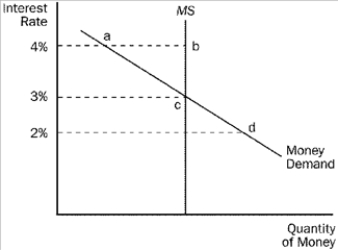 -Refer to Figure 34-1. There is an excess demand for money at an interest rate of
(Multiple Choice)
4.8/5 (38)
Figure 34-3 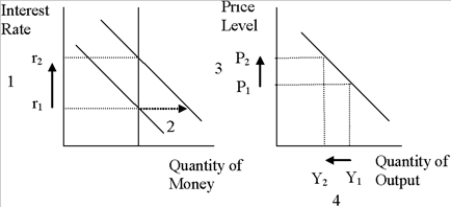 -Refer to Figure 34-3. For an economy such as the United States, what component of the demand for goods and services is most responsible for the decrease in output from Y1 to Y2?
(Multiple Choice)
4.8/5 (22)
According to liquidity preference theory, if the price level increases, then the equilibrium interest rate
(Multiple Choice)
4.9/5 (32)
When Congress reduces spending in order to balance the government's budget, it needs to consider
(Multiple Choice)
4.9/5 (38)
Which of the following actions might we logically expect to result from rising stock prices?
(Multiple Choice)
4.9/5 (24)
Sometimes, changes in monetary policy and/or fiscal policy are intended to offset changes to aggregate demand over which policymakers have little or no control.
(True/False)
4.8/5 (40)
Filters
- Essay(0)
- Multiple Choice(0)
- Short Answer(0)
- True False(0)
- Matching(0)