Exam 16: The Influence of Monetary and Fiscal Policy on Aggregate Demand
Exam 1: Ten Principles of Economics439 Questions
Exam 2: Thinking Like an Economist615 Questions
Exam 3: Interdependence and the Gains From Trade527 Questions
Exam 4: The Market Forces of Supply and Demand697 Questions
Exam 5: Measuring a Nations Income518 Questions
Exam 6: Measuring the Cost of Living543 Questions
Exam 7: Production and Growth507 Questions
Exam 8: Saving, Investment, and the Financial System565 Questions
Exam 9: The Basic Tools of Finance510 Questions
Exam 10: Unemployment and Its Natural Rate698 Questions
Exam 11: The Monetary System517 Questions
Exam 12: Money Growth and Inflation484 Questions
Exam 13: Open-Economy Macroeconomics: Basic Concepts520 Questions
Exam 14: A Macroeconomic Theory of the Open Economy478 Questions
Exam 15: Aggregate Demand and Aggregate Supply563 Questions
Exam 16: The Influence of Monetary and Fiscal Policy on Aggregate Demand510 Questions
Exam 17: The Short-Run Tradeoff Between Inflation and Unemployment516 Questions
Exam 18: Six Debates Over Macroeconomic Policy372 Questions
Select questions type
Explain the logic according to liquidity preference theory by which an increase in the money supply changes the aggregate demand curve.
(Essay)
5.0/5  (44)
(44)
There are three factors that help explain the slope of the aggregate demand curve. Which two are less important? Why are they less important?
(Essay)
4.8/5 (36)
Figure 34-6. On the left-hand graph, MS represents the supply of money and MD represents the demand for money; on the right-hand graph, AD represents aggregate demand. The usual quantities are measured along the axes of both graphs.
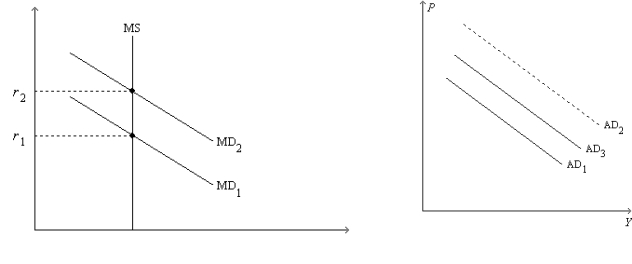 -Refer to Figure 34-6. Suppose the multiplier is 5 and the government increases its purchases by $15 billion. Also, suppose the AD curve would shift from AD1 to AD2 if there were no crowding out; the AD curve actually shifts from AD1 to AD3 with crowding out. Also, suppose the horizontal distance between the curves AD1 and AD3 is $55 billion. The extent of crowding out, for any particular level of the price level, is
(Multiple Choice)
4.8/5 (42)
If expected inflation is constant, then when the nominal interest rate falls, the real interest rate
(Multiple Choice)
4.7/5 (45)
Assume there is a multiplier effect, some crowding out, and no accelerator effect. An increase in government expenditures changes aggregate demand more,
(Multiple Choice)
4.8/5 (32)
A decrease in taxes will shift aggregate demand to the _____, cause consumption to _____, and cause output to _____. Due to the crowding-out effect, investment will _____.
(Short Answer)
4.9/5 (34)
Which of the following tends to make aggregate demand shift further to the right than the amount by which government expenditures increase?
(Multiple Choice)
4.9/5 (37)
Figure 34-2. On the left-hand graph, MS represents the supply of money and MD represents the demand for money; on the right-hand graph, AD represents aggregate demand. The usual quantities are measured along the axes of both graphs.
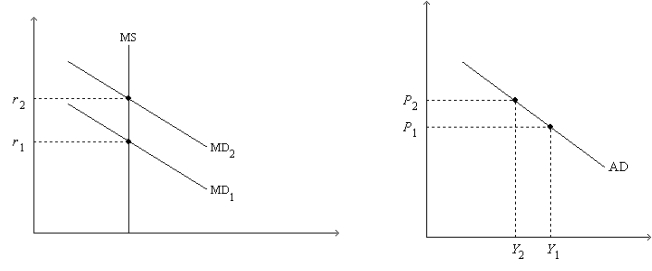 -Refer to Figure 34-2. Assume the money market is always in equilibrium, and suppose r1 = 0.08; r2 = 0.12; Y1 = 13,000; Y2 = 10,000; P1 = 1.0; and P2 = 1.2. Which of the following statements is correct? When P = P2,
(Multiple Choice)
4.9/5 (28)
According to liquidity preference theory, a decrease in money demand for some reason other than a change in the price level causes
(Multiple Choice)
4.9/5 (40)
The government increases both its expenditures and taxes by $400 billion. There is no crowding out and no accelerator effect. Aggregate demand shifts by $400 billion. Which of the following is consistent with how far aggregate demand shifts?
(Multiple Choice)
4.8/5 (39)
Which of the following policies would be advocated by proponents of stabilization policy when the economy is experiencing severe unemployment?
(Multiple Choice)
4.8/5 (43)
Figure 34-6. On the left-hand graph, MS represents the supply of money and MD represents the demand for money; on the right-hand graph, AD represents aggregate demand. The usual quantities are measured along the axes of both graphs.
-Refer to Figure 34-6. Suppose the multiplier is 3 and the government increases its purchases by $25 billion. Also, suppose the AD curve would shift from AD1 to AD2 if there were no crowding out; the AD curve actually shifts from AD1 to AD3 with crowding out. Finally, assume the horizontal distance between the curves AD1 and AD3 is $40 billion. The extent of crowding out, for any particular level of the price level, is
(Multiple Choice)
4.9/5 (41)
If net exports fall $40 billion, the MPC is 9/11, and there is a multiplier effect but no crowding out and no investment accelerator, then
(Multiple Choice)
4.7/5 (29)
According to the theory of liquidity preference, if the interest rate rises
(Multiple Choice)
4.9/5 (37)
Which of the following shifts aggregate demand to the right?
(Multiple Choice)
4.8/5 (29)
Economists who are skeptical about the relevance of "liquidity traps" argue that
(Multiple Choice)
4.8/5 (37)
Figure 34-8 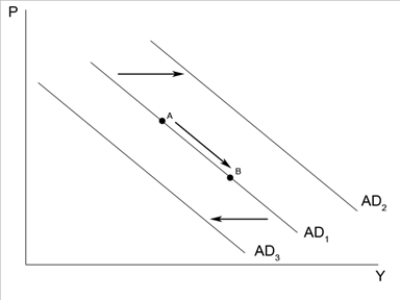 -Refer to Figure 34-8. An increase in taxes will
(Multiple Choice)
4.8/5 (33)
Which of the following events would shift money demand to the right?
(Multiple Choice)
4.8/5 (25)
Filters
- Essay(0)
- Multiple Choice(0)
- Short Answer(0)
- True False(0)
- Matching(0)