Exam 16: The Influence of Monetary and Fiscal Policy on Aggregate Demand
Exam 1: Ten Principles of Economics439 Questions
Exam 2: Thinking Like an Economist615 Questions
Exam 3: Interdependence and the Gains From Trade527 Questions
Exam 4: The Market Forces of Supply and Demand697 Questions
Exam 5: Measuring a Nations Income518 Questions
Exam 6: Measuring the Cost of Living543 Questions
Exam 7: Production and Growth507 Questions
Exam 8: Saving, Investment, and the Financial System565 Questions
Exam 9: The Basic Tools of Finance510 Questions
Exam 10: Unemployment and Its Natural Rate698 Questions
Exam 11: The Monetary System517 Questions
Exam 12: Money Growth and Inflation484 Questions
Exam 13: Open-Economy Macroeconomics: Basic Concepts520 Questions
Exam 14: A Macroeconomic Theory of the Open Economy478 Questions
Exam 15: Aggregate Demand and Aggregate Supply563 Questions
Exam 16: The Influence of Monetary and Fiscal Policy on Aggregate Demand510 Questions
Exam 17: The Short-Run Tradeoff Between Inflation and Unemployment516 Questions
Exam 18: Six Debates Over Macroeconomic Policy372 Questions
Select questions type
On the graph that depicts the theory of liquidity preference,
(Multiple Choice)
4.7/5  (33)
(33)
Assume the money market is initially in equilibrium. If the price level increases, then according to liquidity preference theory there is an excess
(Multiple Choice)
4.8/5 (29)
For the U.S. economy, which of the following helps explain the slope of the aggregate-demand curve?
(Multiple Choice)
4.9/5 (32)
During periods of expansion, automatic stabilizers cause government expenditures
(Multiple Choice)
4.8/5 (41)
When the Federal Reserve increases the Federal Funds target rate, it achieves this target by
(Multiple Choice)
4.9/5 (30)
An implication of the Employment Act of 1946 is that the government should respond to changes in the private economy to stabilize aggregate demand.
(True/False)
4.8/5 (44)
What is the value of the multiplier if the marginal propensity to consume is 0.5?
(Short Answer)
4.8/5 (24)
An open-market purchase by the Federal Reserve creates an excess _____ of money. This causes interest rates to _____ and investment to _____. The change in investment causes aggregate demand to shift to the _____.
(Short Answer)
4.8/5 (30)
Suppose that consumers become pessimistic about the future health of the economy. What will happen to aggregate demand and to output? What might the president and Congress have to do to keep output stable?
(Essay)
4.9/5 (36)
Figure 34-2. On the left-hand graph, MS represents the supply of money and MD represents the demand for money; on the right-hand graph, AD represents aggregate demand. The usual quantities are measured along the axes of both graphs.
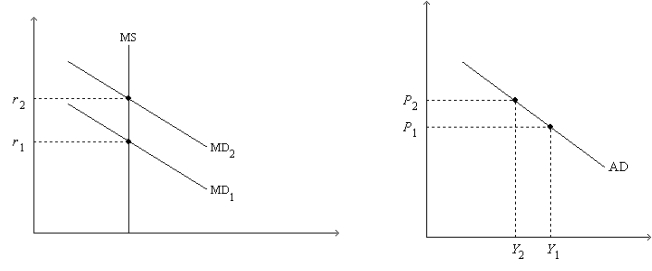 -Refer to Figure 34-2. Which of the following quantities is held constant as we move from one point to another on either graph?
(Multiple Choice)
4.9/5 (34)
To reduce the effects of crowding out caused by an increase in government expenditures, the Federal Reserve could
(Multiple Choice)
4.7/5 (36)
The wealth effect helps explain the slope of the aggregate-demand curve. This effect is
(Multiple Choice)
4.9/5 (35)
Consider the following sequence of events:
Price level ↑ ⇒ demand for money ↑ ⇒ equilibrium interest rate ↑
⇒ quantity of goods and services demanded ↓
Τhis sequence explains why the
(Multiple Choice)
4.9/5 (36)
Which of the following events shifts aggregate demand rightward?
(Multiple Choice)
4.9/5 (35)
Figure 34-5. On the figure, MS represents money supply and MD represents money demand. 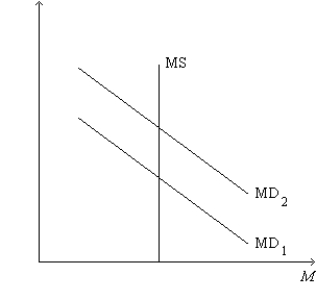 -Refer to Figure 34-5. A shift of the money-demand curve from MD2 to MD1 is consistent with which of the following sets of events?
(Multiple Choice)
4.9/5 (39)
According to liquidity preference theory, the money-supply curve is
(Multiple Choice)
4.9/5 (41)
Other things equal, in the short run a lower price level leads households to
(Multiple Choice)
4.8/5 (31)
Permanent tax cuts have a larger impact on consumption spending than temporary ones.
(True/False)
4.8/5 (38)
Filters
- Essay(0)
- Multiple Choice(0)
- Short Answer(0)
- True False(0)
- Matching(0)