Exam 8: Analyzing Multivariable Change: Optimization
Exam 1: Ingredients of Change: Functions an Limits50 Questions
Exam 2: Describing Change: Rates47 Questions
Exam 3: Determining Change: Derivatives48 Questions
Exam 4: Analyzing Change: Applications of Derivatives50 Questions
Exam 5: Accumulating Change: Limits of Sums and the Definite Integral50 Questions
Exam 6: Analyzing Accumulated Change: Integrals in Action51 Questions
Exam 7: Ingredients of Multivariable Change: Models, Graphs, Rates46 Questions
Exam 8: Analyzing Multivariable Change: Optimization50 Questions
Select questions type
For a region, the percentage of adults 20-24 years of age that have not been married is given in the table below. Use the method of least squares to find the multivariable function f with inputs a and b for the best fitting line  where x is the number of years since 1970.
(Multiple Choice)
4.9/5  (33)
(33)
The table shows the number of days that some food will keep as a function of the temperature. Use the method of least squares to find the best-fitting linear model for the data. Give your coefficients to two decimal places. 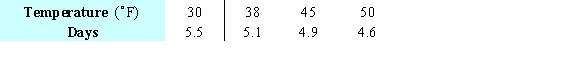
(Multiple Choice)
4.9/5 (29)
Fatty acids are liberated from a fat mixture through a chemical process called hydrolysis. Suppose the number of fatty acids per 100 grams of water can be modeled by  grams, where the pH of the fat mixture is
  and the temperature is
  Find the pH and temperature that maximize the amount of fatty acid. Round your answers to two decimal place.
(Multiple Choice)
4.9/5 (32)
Let  be the SSE function for the best fitting line
  of the data below. Find the minimum value of
  Round your answer to four decimal places.
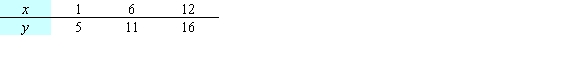
(Multiple Choice)
4.9/5 (35)
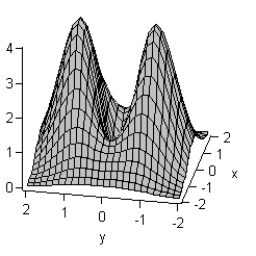
Consider the contour and associated three-dimensional graph of  Is the point at which
  and
and  a relative maximum point, a relative minimum point, or a saddle point?
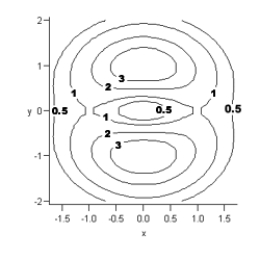
(Multiple Choice)
4.9/5 (37)
For a region, the percentage of adults 20-24 years of age that have not been married is given in the table below. Give the linear model  that best fits this data, where x is the number of years since 1970.
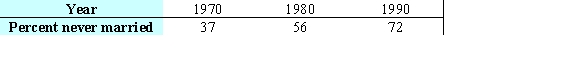
(Multiple Choice)
4.9/5 (46)
Let  be the SSE function for the best fitting line
  of the data below. A student calculated that the minimum of f occurs at
  . Based on this calculation, what is the linear function that best fits the data?
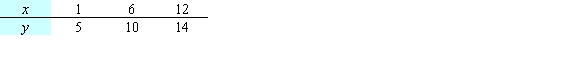
(Multiple Choice)
4.7/5 (29)
A travel agency offers spring-break cruise packages. The agency advertises a cruise to Cancun, Mexico, for $1200 per person. In order to promote the cruise among student organizations on campus, the agency offers a discount for student groups selling the cruise to over 50 of their members. The price per student will be discounted by $10 for each student in excess of 50. For example, if an organization had 55 members go on the cruise, each of those 55 students would pay  . Write a constraint function in terms of the number of students in excess of 50 and the price.
(Multiple Choice)
4.9/5 (42)
Filters
- Essay(0)
- Multiple Choice(0)
- Short Answer(0)
- True False(0)
- Matching(0)