Exam 6: The Normal Distribution
Exam 1: The Nature of Probability and Statistics47 Questions
Exam 2: Frequency Distributions and Graphs73 Questions
Exam 3: Data Description73 Questions
Exam 4: Probability and Counting Rules85 Questions
Exam 5: Discrete Probability Distributions69 Questions
Exam 6: The Normal Distribution81 Questions
Exam 7: Confidence Intervals and Sample Size75 Questions
Exam 8: Hypothesis Testing83 Questions
Exam 9: Testing the Difference Between Two Means, Two Variances, and Two Proportions70 Questions
Exam 10: Correlation and Regression63 Questions
Exam 11: Other Chi-Square Tests47 Questions
Exam 12: Analysis of Variance54 Questions
Exam 13: Nonparametric Statistics63 Questions
Exam 14: Sampling and Simulation58 Questions
Select questions type
The data shown represent quiz scores from Ms. Mayer's 5th grade class. Use the Pearson coefficient to check for skewness.
21 25 9 21 23 22 22 15 23 22 16 11 20 20 17 22 21
(Multiple Choice)
4.8/5  (29)
(29)
Find the z value to the right of the mean such that 85% of the total area under the standard normal distribution curve lies to the left of it? 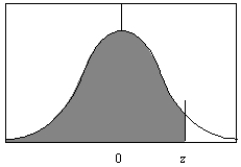
(Short Answer)
4.7/5 (34)
The number of standard deviations a particular X value is from the mean is commonly referred to as ________.
(Multiple Choice)
4.8/5 (32)
Find the probability  using the standard normal distribution.
(Multiple Choice)
4.7/5 (30)
Which of the following characteristics does not apply to a theoretical normal distribution?
(Multiple Choice)
4.9/5 (31)
The area under the standard normal distribution curve to the right of z = 1.83 is 0.4664.
(True/False)
4.9/5 (40)
A(n) _______________________ is employed when a continuous distribution is used to approximate a discrete distribution.
(Short Answer)
4.7/5 (36)
In a standard normal distribution, what z value corresponds to 17% of the data between the mean and the z value?
(Multiple Choice)
4.9/5 (35)
To find the area under the standard normal distribution curve between two z values, one first finds the difference between the two z values, then locates the value corresponding to that difference in the Standard Normal Distribution table.
(True/False)
4.8/5 (36)
The area under a normal distribution curve is always positive even if the z value is negative.
(True/False)
4.8/5 (29)
The average age of vehicles registered in the United States is 96 months. Assume the population is normally distributed with a standard deviation of 15 months. Find the probability that the mean age of a sample of 36 vehicles is between 98 and 100 months?
(Multiple Choice)
4.8/5 (31)
Find the z value to the right of the mean so that 62.93% of the area under the distribution curve lies to the left of it.
(Short Answer)
4.7/5 (40)
X is a normally distributed random variable with a standard deviation of 3.50. Find the mean of X when 64.8% of the area lies to the left of 10.33. (Note: the diagram is not necessarily to scale.) 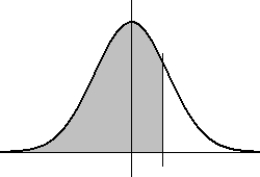
(Multiple Choice)
4.8/5 (33)
The difference between a sample mean and the population mean may be referred to as ______________________.
(Multiple Choice)
4.7/5 (40)
Find the probability  using the standard normal distribution.
(Multiple Choice)
4.8/5 (42)
The average age of doctors in a certain hospital is 45.0 years old. Suppose the distribution of ages is normal and has a standard deviation of 4.0 years. If 16 doctors are chosen at random for a committee, find the probability that the average age of those doctors is less than 45.5 years. Assume that the variable is normally distributed.
(Multiple Choice)
4.8/5 (40)
As the sample size n increases, the shape of the distribution of the sample means taken with replacement from a population with mean and standard deviation , will approach a normal distribution. This distribution will have a mean of and a standard deviation of  . This is a statement of the _______________________.
(Short Answer)
4.9/5 (33)
Of the members of a Boy Scout troop, 15% have received the first aid merit badge. If 40 boy scouts are selected at random, find the probability that four or more will have the first aid merit badge?
(Multiple Choice)
4.9/5 (43)
The figure below is an example of a negatively skewed distribution. 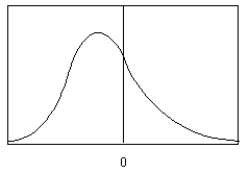
(True/False)
4.7/5 (37)
Filters
- Essay(0)
- Multiple Choice(0)
- Short Answer(0)
- True False(0)
- Matching(0)