Exam 3: Data Description
Exam 1: The Nature of Probability and Statistics47 Questions
Exam 2: Frequency Distributions and Graphs73 Questions
Exam 3: Data Description73 Questions
Exam 4: Probability and Counting Rules85 Questions
Exam 5: Discrete Probability Distributions69 Questions
Exam 6: The Normal Distribution81 Questions
Exam 7: Confidence Intervals and Sample Size75 Questions
Exam 8: Hypothesis Testing83 Questions
Exam 9: Testing the Difference Between Two Means, Two Variances, and Two Proportions70 Questions
Exam 10: Correlation and Regression63 Questions
Exam 11: Other Chi-Square Tests47 Questions
Exam 12: Analysis of Variance54 Questions
Exam 13: Nonparametric Statistics63 Questions
Exam 14: Sampling and Simulation58 Questions
Select questions type
The costs per load (in cents) of 26 dish-washing detergents tested by a consumer organization are shown here. Find the standard deviation of the sample. 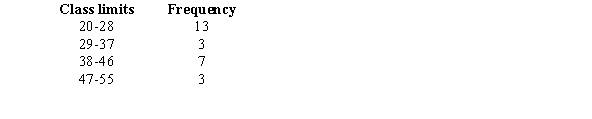
(Multiple Choice)
4.9/5  (40)
(40)
A weighted mean is used when the values of the data set are not all equally represented.
(True/False)
4.8/5 (39)
The average resident of Metro City produces 640 pounds of solid waste each year, and the standard deviation is approximately 90 pounds. Use Chebyshev's theorem to find the weight range that contains at least 75% of all residents' annual garbage weights.
(Multiple Choice)
4.8/5 (41)
Given the following boxplot where m is the median value, what statement could be made about the distribution of the data? 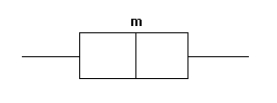
(Multiple Choice)
4.7/5 (31)
Find the mode for the following data?
5, 4, 3, 4, 5, 6, 5, 5, 3, 4
(Multiple Choice)
4.9/5 (34)
The data shown represents the high scores for members of a bowling league over a particular season. Find the approximate percentile rank of a score of 266 by constructing a percentile graph. 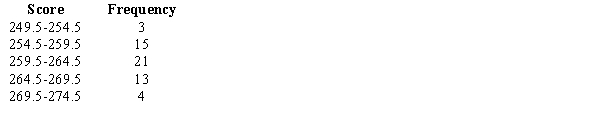
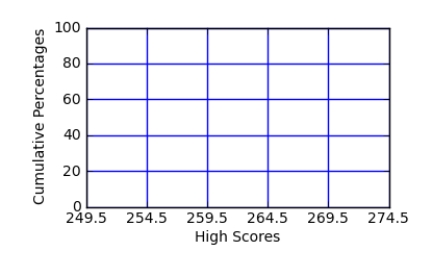
(Multiple Choice)
4.8/5 (29)
If a distribution is negatively skewed as shown in the figure below, the mean will fall to the right of the median and the mode will fall to the left of the median. 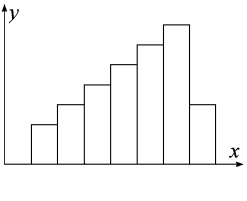
(True/False)
4.9/5 (34)
Find the median of the following data set.
8, 10, 10, 10, 8, 14
(Short Answer)
4.7/5 (38)
A baseball player has a batting average of 0.325 each week of the season, with a standard deviation of 0.065. What is the z score when he bats 0.410 one week?
(Multiple Choice)
4.9/5 (40)
What is the median of the following set of values?
7, 21, 19, 15, 19, 14, 15, 19
(Multiple Choice)
4.7/5 (34)
Determine the range for the following data set.
4, 15, 8, 6, 20
(Multiple Choice)
4.8/5 (37)
The grades for the trigonometry exam are listed below. Find the range.
85, 76, 93, 82, 84, 90, 75
(Multiple Choice)
4.7/5 (39)
The variance of a data set is the square root of the standard deviation.
(True/False)
4.9/5 (37)
A student received the following grades last semester. Find the student's semester grade point average. 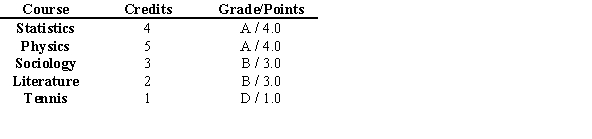
(Multiple Choice)
4.7/5 (29)
Find the median for the following data.
6, 7, 4, 5, 3, 7, 4
(Multiple Choice)
4.8/5 (34)
If a set of data has mean 48 and variance 9, then it's coefficient of variation is ________.
(Short Answer)
4.9/5 (39)
A five-number summary of a data set consists of the minimum,  , the median,
  , and the maximum.
(True/False)
4.8/5 (40)
Filters
- Essay(0)
- Multiple Choice(0)
- Short Answer(0)
- True False(0)
- Matching(0)