Exam 3: Data Description
Exam 1: The Nature of Probability and Statistics47 Questions
Exam 2: Frequency Distributions and Graphs73 Questions
Exam 3: Data Description73 Questions
Exam 4: Probability and Counting Rules85 Questions
Exam 5: Discrete Probability Distributions69 Questions
Exam 6: The Normal Distribution81 Questions
Exam 7: Confidence Intervals and Sample Size75 Questions
Exam 8: Hypothesis Testing83 Questions
Exam 9: Testing the Difference Between Two Means, Two Variances, and Two Proportions70 Questions
Exam 10: Correlation and Regression63 Questions
Exam 11: Other Chi-Square Tests47 Questions
Exam 12: Analysis of Variance54 Questions
Exam 13: Nonparametric Statistics63 Questions
Exam 14: Sampling and Simulation58 Questions
Select questions type
Make a boxplot for the following data set.
24, 15, 34, 92, 68, 34, 78, 45, 53, 67, 83, 46
(Essay)
4.9/5  (37)
(37)
What is the median of the following data set?
8, 11, 15, 16, 20
(Multiple Choice)
4.9/5 (37)
The number of police officers in selected city districts is listed below. Find the mode.
24, 26, 24, 30, 23, 28, 19, 31, 24, 26, 19
(Multiple Choice)
4.8/5 (24)
The median can be a more appropriate measure of central tendency if the distribution of the data is extremely skewed.
(True/False)
4.7/5 (30)
If a set of data has 81 values with a variance of 26.0, then the standard deviation is _________.
(Multiple Choice)
4.8/5 (31)
Given that the mean of a set of data is 25 and the standard deviation is 3, what is the coefficient of variation?
(Multiple Choice)
4.9/5 (39)
Which of the following is the properly rounded mean for the given data?
7, 8, 13, 9, 10, 11
(Multiple Choice)
4.8/5 (45)
The _______________and ______________ are two measures of variation used to describe the spread of the data in a data set.
(Essay)
4.9/5 (25)
The average weekly earnings in dollars for various industries are listed below. Find the percentile rank of 604.
701, 604, 538, 625, 574, 659, 735, 513, 789, 847
(Multiple Choice)
4.9/5 (37)
Check the following data set for outliers.
43, 52, 54, 54, 56, 57, 59, 61
(Essay)
4.8/5 (34)
Find the weighted mean for a particular student's scores on three exams if the first one was worth 75 points and the student received a score of 70%, the second was worth 50 points and the student received a score of 80%, and the third was worth 30 points and the student received a score of 95%?
(Short Answer)
4.9/5 (30)
Given the following data set, find the approximate value that corresponds to the 75th percentile.
10, 44, 15, 23, 14, 18, 72, 56
(Short Answer)
4.8/5 (32)
The range of a data set is the difference between the highest value and the lowest value.
(True/False)
4.9/5 (41)
______________ divide a distribution into four groups, and __________divide a distribution into ten groups.
(Short Answer)
5.0/5 (44)
_______________ identifies a minimum percentage of the data points that fall within a certain distance of the mean, and it applies to any distribution regardless of its shape.
(Short Answer)
4.8/5 (37)
Which plot below has a five-number summary of 5, 7, 8, 12, 13 and an interquartile range of 5?
(Multiple Choice)
4.9/5 (34)
The size of the box in a boxplot shows the ____________________ of the data set.
(Multiple Choice)
4.8/5 (35)
In a unimodal, symmetrical distribution as shown in the figure below, 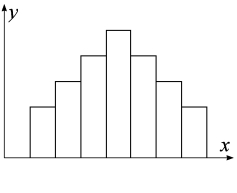
(Multiple Choice)
4.8/5 (33)
A characteristic or measure obtained by using all the data values for a specific population is called a ___________.
(Multiple Choice)
4.8/5 (33)
Filters
- Essay(0)
- Multiple Choice(0)
- Short Answer(0)
- True False(0)
- Matching(0)