Exam 5: Exploring Data: Distributions
Exam 1: Urban Services107 Questions
Exam 2: Business Efficiency104 Questions
Exam 3: Planning and Scheduling108 Questions
Exam 4: Linear Programming111 Questions
Exam 5: Exploring Data: Distributions115 Questions
Exam 6: Exploring Data: Relationships104 Questions
Exam 7: Data for Decisions99 Questions
Exam 8: Probability: the Mathematics of Chance108 Questions
Exam 9: Social Choice: the Impossible Dream103 Questions
Exam 10: The Manipulability of Voting Systems106 Questions
Exam 11: Weighted Voting Systems111 Questions
Exam 12: Electing the President93 Questions
Exam 13: Fair Division121 Questions
Exam 14: Apportionment112 Questions
Exam 15: Game Theory: the Mathematics of Competition113 Questions
Exam 16: Identification Numbers110 Questions
Exam 17: Information Science94 Questions
Exam 18: Growth and Form111 Questions
Exam 19: Symmetry and Patterns115 Questions
Exam 20: Tilings112 Questions
Exam 21: Savings Models113 Questions
Exam 22: Borrowing Models113 Questions
Exam 23: The Economics of Resources119 Questions
Select questions type
For the following Questions assume that the heights of American women ages 18 to 24 are normally distributed, with mean 64.5 inches and standard deviation 2.5 inches.
-Amy's 18-year-old sister Mo is 64 inches tall. Where is she located in the height distribution of women ages 18 to 24?
(Multiple Choice)
4.9/5  (39)
(39)
In a normal distribution with mean 100 and standard deviation 7, which value is more common: a value between 100 and 107, or a value outside the range 93 to 107?
(Short Answer)
4.7/5 (33)
Refer to this stemplot to answer the following questions:
0 1234 1 03 2 14669 3 4 2789
-What is the median of this data set?
(Short Answer)
4.8/5 (31)
Below are the heights (in inches) of students in a third-grade class. Find the median height.
(Multiple Choice)
4.9/5 (34)
Bruce is considering relocating to a new city. His options are Altuna, Boundary Valley, and Collie Creek. All other living expenses seem to be equal for the three choices, but Bruce is worried about his heating and cooling bill. The only information he has at his disposal is the following table: City Mean daily temperature Standard deviation for the daily temperature Altuna 64 15 Boundary Valley 64 16 Collie Creek 64 5 Which city is likely to have the least expensive heating and cooling costs?
(Multiple Choice)
4.9/5 (40)
Use the following information to answer the Questions:
Below are the numbers of pages in each of seven chapters of a textbook.
14, 14, 20, 38, 47, 48, 57
-What is the median number of pages?
(Multiple Choice)
5.0/5 (28)
For the following Questions assume that the heights of American women ages 18 to 24 are normally distributed, with mean 64.5 inches and standard deviation 2.5 inches.
-About what percentage of American women ages 18 to 24 have heights greater than 69.5 inches?
(Multiple Choice)
4.9/5 (33)
Find the standard deviation of the following set of measurements.
4, 7, 9, 11, 13, 22
(Short Answer)
4.9/5 (33)
A data set consists of measurements of lengths in centimeters. What is the unit of the standard deviation?
(Short Answer)
4.8/5 (29)
Refer to the following frequency distribution to answer the questions: Value 1 2 3 6 Relative frequency 25\% 25\% 15\% 35\%
-Which of the following statements describes the mean of the distribution?
(Multiple Choice)
4.9/5 (29)
In the list of five measurements shown below, one is blurred. Supply a fifth value that would make the median 5.
8 5 10 3 \#
(Essay)
4.7/5 (38)
Use the data set 7, 8, 9, 10.
What value can you add to this data set that will make the median equal to 8.5?
(Short Answer)
4.8/5 (29)
Find the standard deviation of the following set of data:
0 5, 7, 17, 31, 45, 47, 68, 85, 96, 99
(Short Answer)
4.8/5 (32)
The scores of students on a standardized test form a normal distribution with a mean of 300 and a standard deviation of 40. What are the lower and upper quartile scores for this test?
(Multiple Choice)
4.8/5 (35)
Below are the scores of 21 students on a history exam. Find the five-number summary of the scores.
(Multiple Choice)
4.8/5 (25)
The distribution of the scores on a standardized exam is approximately normal with mean 400 and standard deviation 35. Between what two values do the middle 50% of scores lie?
(Short Answer)
4.8/5 (33)
Given the histogram below for a set of data, which statement is true? 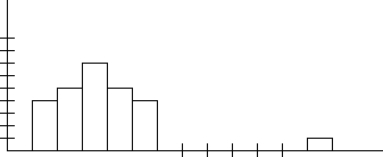
(Multiple Choice)
4.8/5 (43)
Find the mean of the following set of data:
23, 45, 26, 18, 11, 42, 35, 16, 32
(Short Answer)
4.9/5 (37)
Filters
- Essay(0)
- Multiple Choice(0)
- Short Answer(0)
- True False(0)
- Matching(0)