Exam 5: Exploring Data: Distributions
Exam 1: Urban Services107 Questions
Exam 2: Business Efficiency104 Questions
Exam 3: Planning and Scheduling108 Questions
Exam 4: Linear Programming111 Questions
Exam 5: Exploring Data: Distributions115 Questions
Exam 6: Exploring Data: Relationships104 Questions
Exam 7: Data for Decisions99 Questions
Exam 8: Probability: the Mathematics of Chance108 Questions
Exam 9: Social Choice: the Impossible Dream103 Questions
Exam 10: The Manipulability of Voting Systems106 Questions
Exam 11: Weighted Voting Systems111 Questions
Exam 12: Electing the President93 Questions
Exam 13: Fair Division121 Questions
Exam 14: Apportionment112 Questions
Exam 15: Game Theory: the Mathematics of Competition113 Questions
Exam 16: Identification Numbers110 Questions
Exam 17: Information Science94 Questions
Exam 18: Growth and Form111 Questions
Exam 19: Symmetry and Patterns115 Questions
Exam 20: Tilings112 Questions
Exam 21: Savings Models113 Questions
Exam 22: Borrowing Models113 Questions
Exam 23: The Economics of Resources119 Questions
Select questions type
Below is a histogram of car prices on a used-car lot. An advertisement for the lot says the average price of a car for sale is $12,000. Could the advertisement be true? Why or why not? 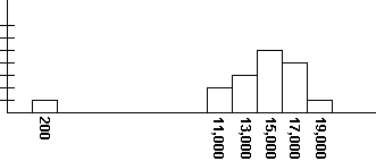
(Essay)
4.7/5  (40)
(40)
If the values in a data set are all multiplied by 1, what happens to the standard deviation?
(Multiple Choice)
4.7/5 (33)
Given the histogram below for a set of data, which statement is true? 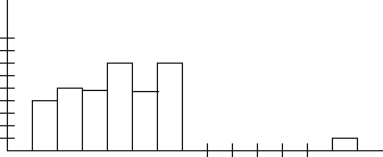
(Multiple Choice)
4.8/5 (34)
The length of students' college careers at Anytown University is known to be normally distributed, with a mean length of 5.5 years and a standard deviation of 1.75 years. What percent of students have college careers lasting between 2 and 9 years?
(Multiple Choice)
4.7/5 (39)
Use the following information to answer the following Questions:
Below are the ages of 15 students in a college class.
27, 50, 33, 25, 86, 25, 85, 31, 37, 44, 20, 36, 59, 34, 28
-What is the mean age?
(Multiple Choice)
4.8/5 (33)
Use the following data sets to answer the questions:
Set A: 1, 2, 3, 4
Set B: 1, 1, 4, 7
Set C: 0, 5, 5, 10
Set D: 6, 6, 6, 6
-Which data set has the largest standard deviation?
(Multiple Choice)
4.9/5 (36)
After computing the standard deviation for a set of measurements, you notice your answer is negative. Is this possible?
(Essay)
4.8/5 (39)
Refer to this stemplot to answer the following questions:
0 1234 1 03 2 14669 3 4 2789
-Find the five-number summary for this data set.
(Short Answer)
4.8/5 (34)
Which of the following statements about measures of the spread of data is true?
(Multiple Choice)
4.8/5 (27)
Use the following data sets to answer the questions:
Set A: 1, 2, 3, 4
Set B: 1, 1, 4, 7
Set C: 0, 5, 5, 10
Set D: 6, 6, 6, 6
-Which data set has standard deviation 0?
(Multiple Choice)
4.9/5 (38)
Below is a list of gas mileage ratings for selected passenger cars in miles per gallon: 53, 43, 89, 41, 85, 86, 91, 92, 95, 94, 86, 102, 114, 30, 123
Choose the correct histogram of the data.
(Multiple Choice)
4.9/5 (31)
Given the histogram below for a set of data, which of the following statements is true? 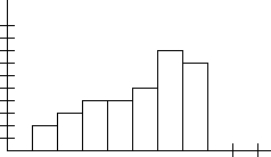
(Multiple Choice)
4.9/5 (32)
Given the histogram below for a set of data, which statement is true? 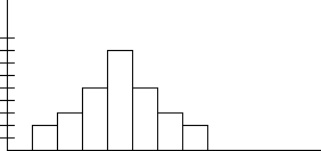
(Multiple Choice)
4.7/5 (37)
Use the following information to answer the Questions:
Below is a list of the number of dogs owned by families in a particular neighborhood.
0, 0, 2, 1, 0, 1, 0, 4, 0, 1
-What is the standard deviation for these data?
(Multiple Choice)
4.8/5 (38)
Below is a list of gas mileage ratings for selected passenger cars in miles per gallon:
53, 43, 89, 41, 85, 86, 91, 92, 95, 94, 86, 102, 114, 30, 123 Make a boxplot to represent these data.
(Essay)
4.9/5 (38)
Filters
- Essay(0)
- Multiple Choice(0)
- Short Answer(0)
- True False(0)
- Matching(0)