Exam 5: Exploring Data: Distributions
Exam 1: Urban Services107 Questions
Exam 2: Business Efficiency104 Questions
Exam 3: Planning and Scheduling108 Questions
Exam 4: Linear Programming111 Questions
Exam 5: Exploring Data: Distributions115 Questions
Exam 6: Exploring Data: Relationships104 Questions
Exam 7: Data for Decisions99 Questions
Exam 8: Probability: the Mathematics of Chance108 Questions
Exam 9: Social Choice: the Impossible Dream103 Questions
Exam 10: The Manipulability of Voting Systems106 Questions
Exam 11: Weighted Voting Systems111 Questions
Exam 12: Electing the President93 Questions
Exam 13: Fair Division121 Questions
Exam 14: Apportionment112 Questions
Exam 15: Game Theory: the Mathematics of Competition113 Questions
Exam 16: Identification Numbers110 Questions
Exam 17: Information Science94 Questions
Exam 18: Growth and Form111 Questions
Exam 19: Symmetry and Patterns115 Questions
Exam 20: Tilings112 Questions
Exam 21: Savings Models113 Questions
Exam 22: Borrowing Models113 Questions
Exam 23: The Economics of Resources119 Questions
Select questions type
The annual income of residents in a certain county is normally distributed, with a mean of $42,000 and a standard deviation of $10,000. What is the probability that a randomly chosen resident has income over $52,000?
(Multiple Choice)
4.9/5  (36)
(36)
Use the following data sets to answer the questions:
Set A: 1, 2, 3, 4
Set B: 1, 1, 4, 7
Set C: 0, 5, 5, 10
Set D: 6, 6, 6, 6
-Which data set has the largest mean?
(Multiple Choice)
4.9/5 (31)
Below are the numbers of accidents occurring at a certain corner on 15 consecutive days. Find the five-number summary of the data.
(Multiple Choice)
4.8/5 (41)
Below are listed the ages (in months) of children at a daycare center. Choose the correct stemplot of the data.
18, 24, 25, 35, 37, 42, 47, 48, 48, 58
(Multiple Choice)
4.8/5 (31)
In the list of five measurements shown below, one is blurred. Supply a fifth value that would make the median 8.
8 5 10 3 \#
(Essay)
4.8/5 (40)
Given the stemplot below, which description is true?
0 1 1 89 2 0122 3 0023
(Multiple Choice)
4.8/5 (43)
Below are the heights (in inches) of students in a third-grade class. Find the mean height.
(Multiple Choice)
4.8/5 (27)
The shelf life of a battery produced by one major company is known to be normally distributed, with a mean life of 3.5 years and a standard deviation of 0.75 years. What percent of batteries last between 1.25 and 5.75 years?
(Multiple Choice)
4.9/5 (39)
Below are the ages of students attending an art exhibit. Find the mean age of the students.
11, 11, 12, 12, 13, 1 3, 13, 13, 13, 14, 14, 15, 15, 15, 16, 16, 17, 17, 18
(Short Answer)
4.8/5 (45)
Consider the following data set: 1, 1, 3, 3, 6, 6, 6, 9, 11, 11
What is the relative frequency of the value 6?
(Multiple Choice)
4.9/5 (39)
The scores of students on a standardized test form a normal distribution with a mean score of 500 and a standard deviation of 100. Between what two values do the middle 50% of scores lie?
(Essay)
4.8/5 (35)
Below is a histogram of the ages of people attending a concert. Which statement is true? 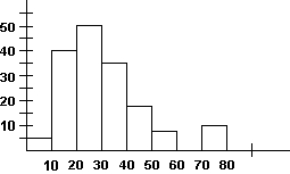
(Multiple Choice)
4.8/5 (39)
The scores of students on a standardized test are normally distributed with a mean of 300 and a standard deviation of 40. Between what two values do 99.7% of the test scores lie?
(Multiple Choice)
4.8/5 (29)
In the list of five measurements shown below, one is blurred. What MUST this value be, if the mean of the five measurements is 7?
8 5 10 3 \#
(Short Answer)
4.8/5 (33)
Below are the ages of six patients seen by a pediatrician on one day. Find the standard deviation of the ages.
3, 6, 7, 9, 15, 20
(Essay)
4.7/5 (32)
Which of the following statements about measures of the center of a distribution of data is true?
(Multiple Choice)
4.7/5 (41)
Use the following information to answer the Questions:
Below are the numbers of pages in each of seven chapters of a textbook.
14, 14, 20, 38, 47, 48, 57
-What is the range?
(Multiple Choice)
4.9/5 (33)
Refer to the following frequency distribution to answer the questions: Value 1 2 3 6 Relative frequency 25\% 25\% 15\% 35\%
-If the data set contains 20 values, how many of them are 3?
(Multiple Choice)
4.7/5 (42)
Use the following data sets to answer the questions:
Set A: 1, 2, 3, 4
Set B: 1, 1, 4, 7
Set C: 0, 5, 5, 10
Set D: 6, 6, 6, 6
-Which data set does NOT have a symmetric distribution?
(Multiple Choice)
4.9/5 (31)
Filters
- Essay(0)
- Multiple Choice(0)
- Short Answer(0)
- True False(0)
- Matching(0)