Exam 10: Aggregate Demand and Aggregate Supply
Exam 1: Limits, Alternatives, and Choices261 Questions
Exam 2: The Market System and the Circular Flow112 Questions
Exam 4: Introduction to Macroeconomics58 Questions
Exam 5: Measuring the Economys Output183 Questions
Exam 6: Economic Growth113 Questions
Exam 7: Business Cycles, Unemployment, and Inflation184 Questions
Exam 8: Basic Macroeconomic Relationships188 Questions
Exam 9: The Aggregate Expenditures Model235 Questions
Exam 10: Aggregate Demand and Aggregate Supply195 Questions
Exam 11: Fiscal Policy, Deficits, Surpluses, and Debt223 Questions
Exam 12: Money, Banking, and Money Creation286 Questions
Exam 13: Interest Rates and Monetary Policy376 Questions
Exam 14: Financial Economics51 Questions
Exam 15: Long-Run Macroeconomic Adjustments122 Questions
Exam 16: International Trade181 Questions
Exam 17: Exchange Rates and the Balance of Payments127 Questions
Select questions type
Refer to the information below. A change in net export spending would most likely be caused by changes in: The following list of factors is related to the aggregate demand curve. 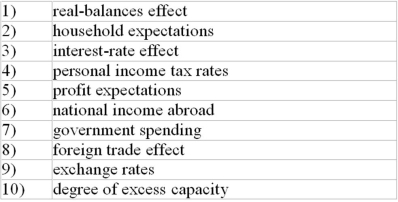
(Multiple Choice)
4.8/5  (40)
(40)
Which of the factors below best explain the downward slope of aggregate demand curve? The following list of factors, are related to the aggregate demand curve. 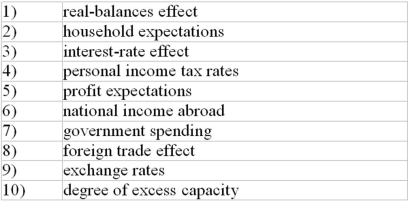
(Multiple Choice)
4.8/5 (33)
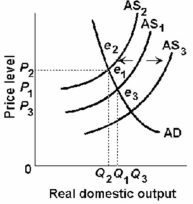 -Refer to the above diagram. If aggregate supply shifts from AS1 to AS3, then real domestic output will:
(Multiple Choice)
4.9/5 (37)
The following aggregate demand and supply schedules are for a hypothetical economy:
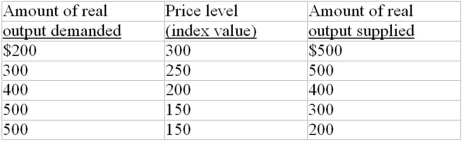 -Refer to the above data. The equilibrium price level will be:
(Multiple Choice)
4.8/5 (34)
Refer to the data below. The vertical range of the aggregate supply curve is associated with price levels: The following aggregate demand and supply schedules are for a hypothetical economy: 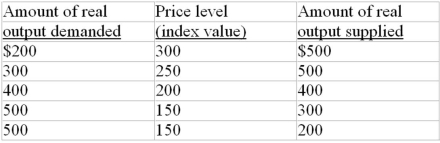
(Multiple Choice)
4.9/5 (31)
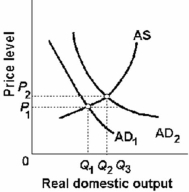 -Refer to the above diagram. If AD1 shifts to AD2, then the equilibrium output and price level are:
(Multiple Choice)
4.9/5 (37)
Assume that an initial change in spending of $10 billion results in a rightward shift in aggregate demand that increases real GDP by $40 billion. The multiplier is:
(Multiple Choice)
4.7/5 (35)
Per-unit production cost is determined by dividing output by total input cost.
(True/False)
4.9/5 (39)
An economy is employing 2 units of capital, 5 units of raw materials, and 8 units of labour to produce its total output of 640 units. Each unit of capital costs $10, each unit of raw materials, $4, and each unit of labour, $3.
-Refer to the above information. As a result of the change indicated in the previous question, the aggregate:
(Multiple Choice)
4.9/5 (28)
The aggregate demand curve can be derived from the aggregate expenditures model as indicated by the fact that:
(Multiple Choice)
4.9/5 (38)
Refer to the diagram below. Other things equal, a shift of the aggregate supply curve from AS0 to AS1 might be caused by a(n): 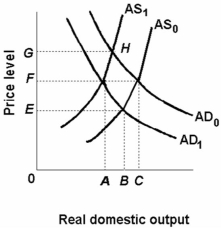
(Multiple Choice)
4.9/5 (29)
An increase in government spending can be expected to shift the:
(Multiple Choice)
4.8/5 (37)
Filters
- Essay(0)
- Multiple Choice(0)
- Short Answer(0)
- True False(0)
- Matching(0)