Exam 10: Aggregate Demand and Aggregate Supply
Exam 1: Limits, Alternatives, and Choices261 Questions
Exam 2: The Market System and the Circular Flow112 Questions
Exam 4: Introduction to Macroeconomics58 Questions
Exam 5: Measuring the Economys Output183 Questions
Exam 6: Economic Growth113 Questions
Exam 7: Business Cycles, Unemployment, and Inflation184 Questions
Exam 8: Basic Macroeconomic Relationships188 Questions
Exam 9: The Aggregate Expenditures Model235 Questions
Exam 10: Aggregate Demand and Aggregate Supply195 Questions
Exam 11: Fiscal Policy, Deficits, Surpluses, and Debt223 Questions
Exam 12: Money, Banking, and Money Creation286 Questions
Exam 13: Interest Rates and Monetary Policy376 Questions
Exam 14: Financial Economics51 Questions
Exam 15: Long-Run Macroeconomic Adjustments122 Questions
Exam 16: International Trade181 Questions
Exam 17: Exchange Rates and the Balance of Payments127 Questions
Select questions type
Refer to the diagram below. Which of the following would shift the aggregate demand curve from AD2 to AD1? 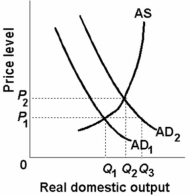
(Multiple Choice)
4.9/5  (34)
(34)
The passage of new legislation requiring more extensive government regulation of business will most likely:
(Multiple Choice)
4.7/5 (32)
The shape of the aggregate demand curve is explained by the:
(Multiple Choice)
4.8/5 (34)
Suppose that real domestic output in an economy is 20 units, the quantity of inputs is 10, and the price of each input is $4.
-Refer to the information above, the level of productivity is:
(Multiple Choice)
4.8/5 (37)
If there is a decrease in the price level, then it will increase aggregate expenditures and this change is equivalent to a(n):
(Multiple Choice)
4.9/5 (45)
Which effect best explains the downward slope of the aggregate demand curve?
(Multiple Choice)
5.0/5 (30)
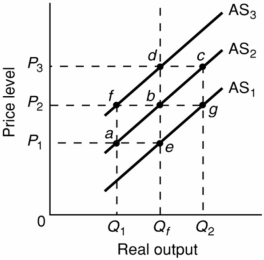 -Refer to the above diagram. Assume that nominal wages initially are set on the basis of the price level P2 and that the economy initially is operating at its full-employment level of output Qf. In the long run, demand-pull inflation could best be shown as:
(Multiple Choice)
4.7/5 (38)
A decrease in interest rates caused by a change in the price level would cause a(n):
(Multiple Choice)
4.9/5 (31)
 -Refer to the above diagram. When output increases from Q1 and the price level decreases from P1, this change will:
(Multiple Choice)
4.9/5 (38)
 -Refer to the above diagram. Assume that nominal wages initially are set on the basis of the price level P2 and that the economy initially is operating at its full-employment level of output Qf. In terms of this diagram, the long-run aggregate supply curve:
(Multiple Choice)
4.8/5 (37)
A decrease in consumer spending can be expected to shift the:
(Multiple Choice)
4.7/5 (37)
If the current price level was such that the aggregate quantity demanded exceeded the aggregate quantity supplied, we would expect:
(Multiple Choice)
4.9/5 (42)
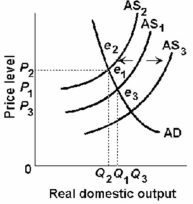
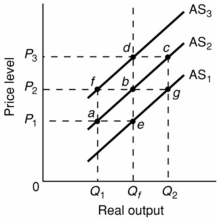
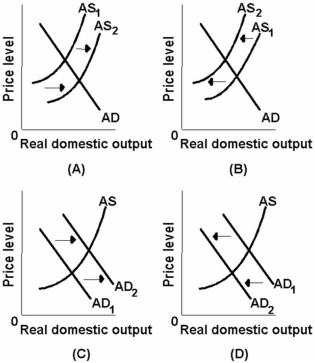 -Which of the above diagrams best portrays the effects of declines in the prices of imported resources?
(Multiple Choice)
4.7/5 (32)
An increase in imports (independently of a change in our price level) will increase both aggregate supply and aggregate demand.
(True/False)
4.7/5 (30)
Other things equal, if the international value of the dollar were to depreciate, the:
(Multiple Choice)
4.8/5 (28)
An economy is employing 2 units of capital, 5 units of raw materials, and 8 units of labour to produce its total output of 640 units. Each unit of capital costs $10, each unit of raw materials, $4, and each unit of labour, $3.
-Refer to the above information. If the per unit price of raw materials rises from $4 to $8 and all else remains constant, the per unit cost of production will rise by about:
(Multiple Choice)
4.9/5 (37)
Filters
- Essay(0)
- Multiple Choice(0)
- Short Answer(0)
- True False(0)
- Matching(0)