Exam 10: Aggregate Demand and Aggregate Supply
Exam 1: Limits, Alternatives, and Choices261 Questions
Exam 2: The Market System and the Circular Flow112 Questions
Exam 4: Introduction to Macroeconomics58 Questions
Exam 5: Measuring the Economys Output183 Questions
Exam 6: Economic Growth113 Questions
Exam 7: Business Cycles, Unemployment, and Inflation184 Questions
Exam 8: Basic Macroeconomic Relationships188 Questions
Exam 9: The Aggregate Expenditures Model235 Questions
Exam 10: Aggregate Demand and Aggregate Supply195 Questions
Exam 11: Fiscal Policy, Deficits, Surpluses, and Debt223 Questions
Exam 12: Money, Banking, and Money Creation286 Questions
Exam 13: Interest Rates and Monetary Policy376 Questions
Exam 14: Financial Economics51 Questions
Exam 15: Long-Run Macroeconomic Adjustments122 Questions
Exam 16: International Trade181 Questions
Exam 17: Exchange Rates and the Balance of Payments127 Questions
Select questions type
Changes in which of the two factors below would most likely cause a change in consumer spending? The following list of factors, are related to the aggregate demand curve. 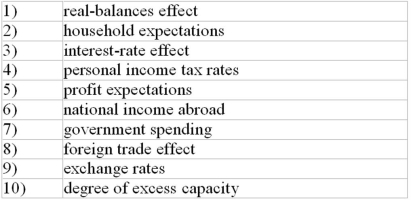
(Multiple Choice)
4.7/5  (37)
(37)
A n expected rise in the rate of inflation for consumer goods will:
(Multiple Choice)
4.9/5 (38)
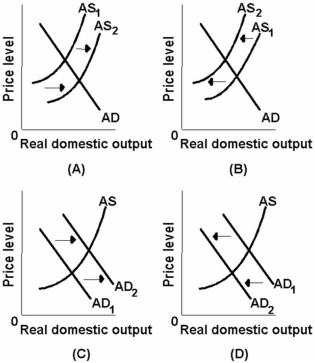 -Which of the above diagrams best portrays the effects of a dramatic increase in energy prices?
(Multiple Choice)
4.8/5 (37)
If real output rises and the price level falls, this would likely be due to a:
(Multiple Choice)
4.8/5 (40)
Suppose that nominal wages fall and productivity rises in a particular economy. Other things equal, the aggregate:
(Multiple Choice)
4.8/5 (30)
Refer to the list below. Which two factors would most likely cause a change in investment spending? The following list of items is related to aggregate demand. 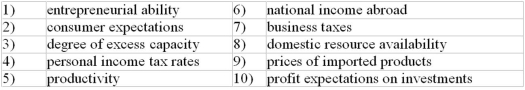
(Multiple Choice)
4.7/5 (39)
In which of the following sets of circumstances can we confidently expect inflation?
(Multiple Choice)
4.9/5 (38)
Which would most likely shift the aggregate supply curve? A change in:
(Multiple Choice)
4.7/5 (33)
-Which of the above diagrams best portrays the effects of an increase in productivity?
(Multiple Choice)
4.9/5 (36)
The aggregate expenditures model and the aggregate demand curve can be reconciled because, other things being equal, in the aggregate expenditures model:
(Multiple Choice)
4.7/5 (31)
The per unit cost of production in the economy described above is:
(Multiple Choice)
4.7/5 (41)
Suppose the full-employment level of real output (Q) for a hypothetical economy is $500 and that the price level (P) initially is 100. Use the following short-run aggregate supply schedules to answer the next question.
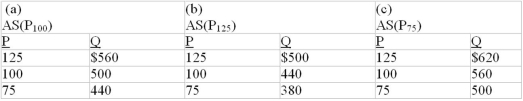 -Refer to the information above. In the long run, an increase in the price level from 100 to 125 will:
(Multiple Choice)
4.8/5 (42)
An increase in aggregate demand is most likely to be caused by a decrease in:
(Multiple Choice)
4.8/5 (31)
Refer to the diagram below. Assume that nominal wages initially are set on the basis of the price level P2 and that the economy initially is operating at its full-employment level of output Qf. In the short run, cost-push inflation could best be shown as: 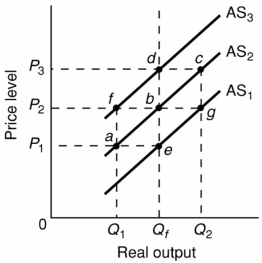
(Multiple Choice)
4.9/5 (32)
An increase in aggregate expenditures resulting from a decrease in the price level is equivalent to a:
(Multiple Choice)
4.9/5 (31)
Refer to the above information. Given an increase in input price from $4 to $6, we would expect the aggregate:
(Multiple Choice)
4.9/5 (33)
Refer to the above diagram. If the price level rises above P1 because of an increase in aggregate demand, the:
(Multiple Choice)
4.8/5 (33)
Filters
- Essay(0)
- Multiple Choice(0)
- Short Answer(0)
- True False(0)
- Matching(0)