Exam 10: Aggregate Demand and Aggregate Supply
Exam 1: Limits, Alternatives, and Choices261 Questions
Exam 2: The Market System and the Circular Flow112 Questions
Exam 4: Introduction to Macroeconomics58 Questions
Exam 5: Measuring the Economys Output183 Questions
Exam 6: Economic Growth113 Questions
Exam 7: Business Cycles, Unemployment, and Inflation184 Questions
Exam 8: Basic Macroeconomic Relationships188 Questions
Exam 9: The Aggregate Expenditures Model235 Questions
Exam 10: Aggregate Demand and Aggregate Supply195 Questions
Exam 11: Fiscal Policy, Deficits, Surpluses, and Debt223 Questions
Exam 12: Money, Banking, and Money Creation286 Questions
Exam 13: Interest Rates and Monetary Policy376 Questions
Exam 14: Financial Economics51 Questions
Exam 15: Long-Run Macroeconomic Adjustments122 Questions
Exam 16: International Trade181 Questions
Exam 17: Exchange Rates and the Balance of Payments127 Questions
Select questions type
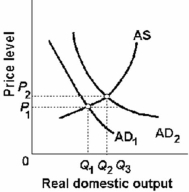
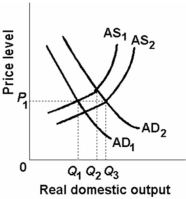 -In the above figure AD1 and AS1 represent the original aggregate supply and demand curves and AD2 and AS2 show the new aggregate demand and supply curves. At the original equilibrium price and quantity, this economy is experiencing:
(Multiple Choice)
4.8/5  (26)
(26)
An increase in the price level in the aggregate expenditures model would:
(Multiple Choice)
4.9/5 (37)
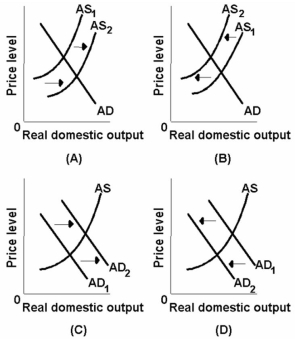 -Which of the above diagrams best portrays the effects of a substantial reduction in government spending?
(Multiple Choice)
4.9/5 (32)
Suppose the full-employment level of real output (Q) for a hypothetical economy is $500 and that the price level (P) initially is 100. Use the following short-run aggregate supply schedules to answer the next question.
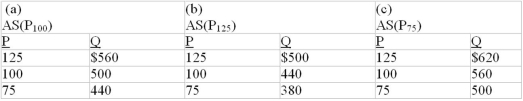 -Refer to the information above. In the long run, a fall in the price level from 100 to 75 will:
(Multiple Choice)
4.8/5 (41)
An increase in investment spending caused by a decline in the interest rate will:
(Multiple Choice)
4.9/5 (40)
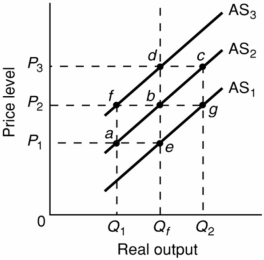 -Refer to the above diagram. Assume that nominal wages initially are set on the basis of the price level P2 and that the economy initially is operating at its full-employment level of output Qf. In the short run, demand-pull inflation could best be shown as:
(Multiple Choice)
4.9/5 (27)
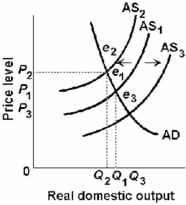 -Refer to the above diagram. Cost-push inflation can be illustrated by a:
(Multiple Choice)
4.9/5 (36)
Refer to the information below. Investment spending would most likely be influenced by changes in: The following list of factors, are related to the aggregate demand curve. 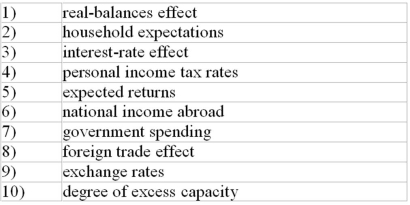
(Multiple Choice)
4.7/5 (31)
The horizontal shape of the immediate short run aggregate supply implies that:
(Multiple Choice)
4.8/5 (35)
The equilibrium price level and level of real output occur where:
(Multiple Choice)
4.8/5 (28)
The foreign trade effect suggests that an increase in the Canadian price level relative to other countries will:
(Multiple Choice)
4.8/5 (46)
 -Refer to the above diagram. When AD1 shifts to AD2, then at P1Q3 output demanded will:
(Multiple Choice)
4.8/5 (31)
-In the above figure AD1 and AS1 represent the original aggregate supply and demand curves and AD2 and AS2 show the new aggregate demand and supply curves. The change in aggregate supply from AS 1 to AS2 could be caused by:
(Multiple Choice)
4.9/5 (35)
Minimum wage laws tend to make the price level more flexible rather than less flexible.
(True/False)
4.8/5 (35)
The following table shows the aggregate demand and aggregate supply schedule for a hypothetical economy.
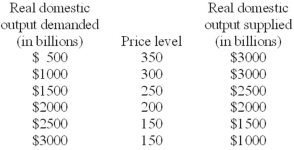 -Refer to the above table. If the quantity of real domestic output demanded decreased by $500 and the quantity of real domestic output supplied increased by $500 at each price level, the new equilibrium price level and quantity of real domestic output would be:
(Multiple Choice)
4.8/5 (35)
Which one of the following would not shift the aggregate demand curve?
(Multiple Choice)
4.8/5 (36)
Filters
- Essay(0)
- Multiple Choice(0)
- Short Answer(0)
- True False(0)
- Matching(0)