Exam 9: Application: International Trade
Exam 1: Ten Principles of Economics438 Questions
Exam 2: Thinking Like an Economist620 Questions
Exam 3: Interdependence and the Gains From Trade527 Questions
Exam 4: The Market Forces of Supply and Demand700 Questions
Exam 5: Elasticity and Its Application598 Questions
Exam 6: Supply, Demand, and Government Policies648 Questions
Exam 7: Consumers, Producers, and the Efficiency of Markets550 Questions
Exam 8: Application: The Costs of Taxation514 Questions
Exam 9: Application: International Trade496 Questions
Exam 10: Externalities522 Questions
Exam 11: Public Goods and Common Resources434 Questions
Exam 12: The Costs of Production420 Questions
Exam 13: Firms in Competitive Markets543 Questions
Exam 14: Monopoly637 Questions
Exam 15: Measuring a Nations Income522 Questions
Exam 16: Measuring the Cost of Living545 Questions
Exam 17: Production and Growth507 Questions
Exam 18: Saving, Investment, and the Financial System567 Questions
Exam 19: The Basic Tools of Finance513 Questions
Exam 20: Unemployment699 Questions
Exam 21: The Monetary System518 Questions
Exam 22: Money Growth and Inflation487 Questions
Exam 23: Aggregate Demand and Aggregate Supply563 Questions
Exam 24: The Influence of Monetary and Fiscal Policy on Aggregate Demand512 Questions
Select questions type
Which of the following is not an advantage of a multilateral approach to free trade over a unilateral approach?
(Multiple Choice)
4.9/5  (34)
(34)
Figure 9-21
The following diagram shows the domestic demand and domestic supply for a market. In addition, assume that the world price in this market is $40 per unit. 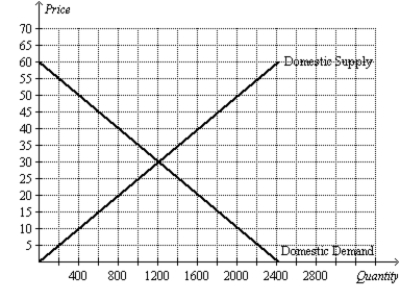 -Refer to Figure 9-21. Consumer surplus with free trade is
(Multiple Choice)
4.9/5 (38)
Figure 9-6
The figure illustrates the market for roses in a country. 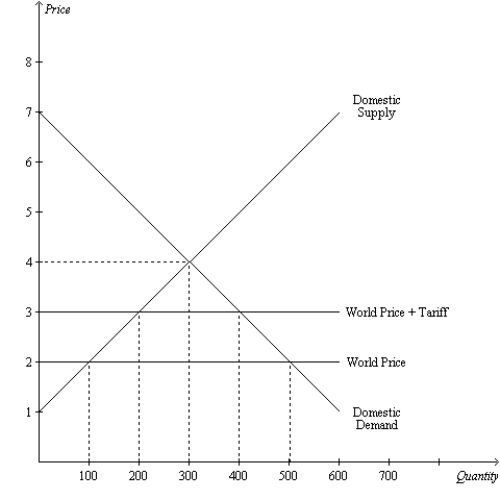 -Refer to Figure 9-6. With trade and without a tariff,
(Multiple Choice)
4.9/5 (32)
Suppose that Australia imposes a tariff on imported beef. If the increase in producer surplus is $100 million, the increase in tariff revenue is $200 million, and the reduction in consumer surplus is $500 million, the deadweight loss of the tariff is $300 million.
(True/False)
4.8/5 (35)
Since World War II, GATT has been responsible for reducing the average tariff among member countries from about
(Multiple Choice)
4.8/5 (40)
Figure 9-6
The figure illustrates the market for roses in a country.
-Refer to Figure 9-6. The amount of revenue collected by the government from the tariff is
(Multiple Choice)
4.8/5 (35)
When a certain nation abandoned a policy of prohibiting international trade in automobiles in favor of a free-tree policy, the result was that the country began to import automobiles. The change in policy improved the well-being of that nation in the sense that
(Multiple Choice)
4.9/5 (35)
When a country allows trade and becomes an exporter of a good,
(Multiple Choice)
4.9/5 (38)
Some goods can be produced at low cost only if they are produced in large quantities. This phenomenon is called
(Multiple Choice)
4.9/5 (30)
Figure 9-23
The following diagram shows the domestic demand and domestic supply for a market. Assume that the world price in this market is $120 per unit. 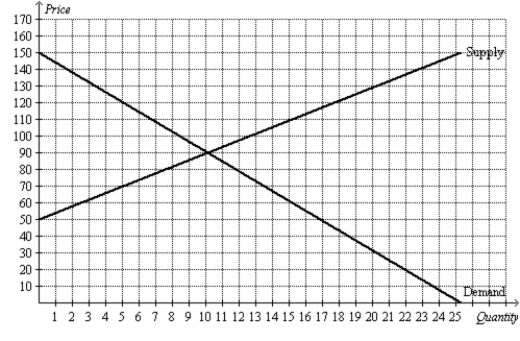 -Refer to Figure 9-23. Consumer surplus with free trade is
(Multiple Choice)
4.8/5 (38)
A logical starting point from which the study of international trade begins is
(Multiple Choice)
4.7/5 (37)
Figure 9-2
The figure illustrates the market for calculators in a country. 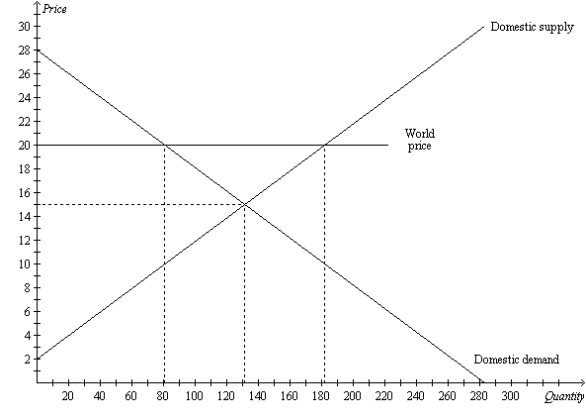 -Refer to Figure 9-2. With free trade, this country will
(Multiple Choice)
4.9/5 (37)
If the world price of coffee is higher than Colombia's domestic price of coffee without trade, then Colombia
(Multiple Choice)
4.8/5 (33)
Within a country, the domestic price of a product will equal the world price if
(Multiple Choice)
4.9/5 (35)
An important factor in the decline of the U.S. textile industry over the past 100 or so years is
(Multiple Choice)
4.7/5 (35)
The two basic approaches that a country can take as a means to achieve free trade are the
(Multiple Choice)
4.7/5 (42)
Suppose the nation of Canada forbids international trade. In Canada, you can obtain a hockey stick by trading 5 baseball bats. In other countries, you can obtain a hockey stick by trading 8 baseball bats. These facts indicate that
(Multiple Choice)
4.9/5 (39)
Figure 9-16. The figure below illustrates a tariff. On the graph, Q represents quantity and P represents price. 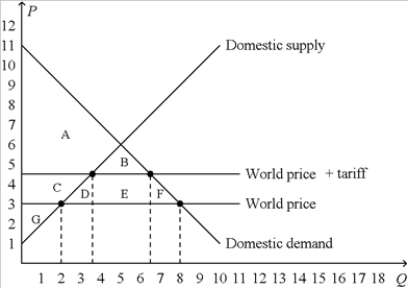 -Refer to Figure 9-16. The deadweight loss created by the tariff is represented by the area
(Multiple Choice)
4.9/5 (40)
Figure 9-8. On the diagram below, Q represents the quantity of cars and P represents the price of cars. 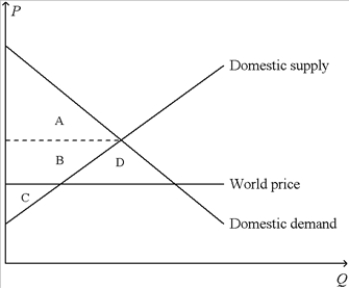 -Refer to Figure 9-8. When the country for which the figure is drawn allows international trade in cars,
(Multiple Choice)
4.8/5 (37)
Filters
- Essay(0)
- Multiple Choice(0)
- Short Answer(0)
- True False(0)
- Matching(0)