Exam 9: Application: International Trade
Exam 1: Ten Principles of Economics438 Questions
Exam 2: Thinking Like an Economist620 Questions
Exam 3: Interdependence and the Gains From Trade527 Questions
Exam 4: The Market Forces of Supply and Demand700 Questions
Exam 5: Elasticity and Its Application598 Questions
Exam 6: Supply, Demand, and Government Policies648 Questions
Exam 7: Consumers, Producers, and the Efficiency of Markets550 Questions
Exam 8: Application: The Costs of Taxation514 Questions
Exam 9: Application: International Trade496 Questions
Exam 10: Externalities522 Questions
Exam 11: Public Goods and Common Resources434 Questions
Exam 12: The Costs of Production420 Questions
Exam 13: Firms in Competitive Markets543 Questions
Exam 14: Monopoly637 Questions
Exam 15: Measuring a Nations Income522 Questions
Exam 16: Measuring the Cost of Living545 Questions
Exam 17: Production and Growth507 Questions
Exam 18: Saving, Investment, and the Financial System567 Questions
Exam 19: The Basic Tools of Finance513 Questions
Exam 20: Unemployment699 Questions
Exam 21: The Monetary System518 Questions
Exam 22: Money Growth and Inflation487 Questions
Exam 23: Aggregate Demand and Aggregate Supply563 Questions
Exam 24: The Influence of Monetary and Fiscal Policy on Aggregate Demand512 Questions
Select questions type
Figure 9-1
The figure illustrates the market for coffee in Guatemala. 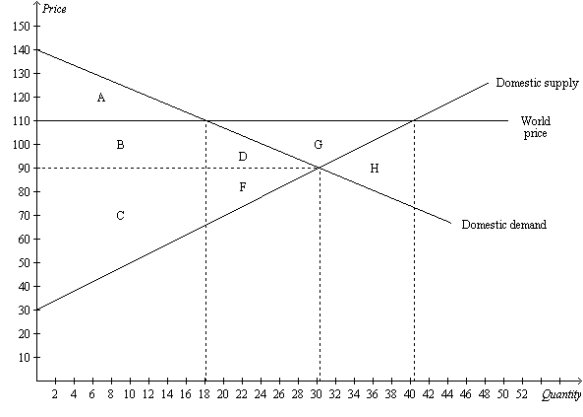 -Refer to Figure 9-1. In the absence of trade, total surplus in the Guatemalan coffee market amounts to
(Multiple Choice)
4.9/5  (45)
(45)
In 2008, the Los Angeles Times asked members of the American public whether free international trade has helped or hurt the economy. Of those surveyed,
(Multiple Choice)
4.9/5 (35)
Figure 9-29
The following diagram shows the domestic demand and domestic supply curves in a market. Assume that the world price in this market is $1 per unit. 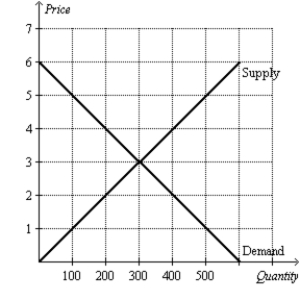 -Refer to Figure 9-29. Suppose the country imposes a $1 per unit tariff. If the country allows trade with a tariff, what will be the domestic price in this market?
(Short Answer)
4.8/5 (36)
Economists agree that trade ought to be restricted if free trade means that domestic jobs might be lost because of foreign competition.
(True/False)
4.8/5 (34)
Figure 9-10. The figure applies to Mexico and the good is rifles.  -Refer to Figure 9-10. With trade, the equilibrium price of rifles and the equilibrium quantity of rifles demanded in Mexico are
(Multiple Choice)
4.8/5 (40)
The nation of Aquilonia has decided to end its policy of not trading with the rest of the world. When it ends its trade restrictions, it discovers that it is importing rice, exporting steel, and neither importing nor exporting TVs. We can conclude that producer surplus in Aquilonia is now
(Multiple Choice)
4.8/5 (24)
Figure 9-29
The following diagram shows the domestic demand and domestic supply curves in a market. Assume that the world price in this market is $1 per unit.
-Refer to Figure 9-29. If the country allows free trade, how many units will domestic consumers demand and how many units will domestic producers supply?
(Essay)
4.8/5 (31)
Patterns of trade among nations are primarily determined by
(Multiple Choice)
4.7/5 (34)
Figure 9-12 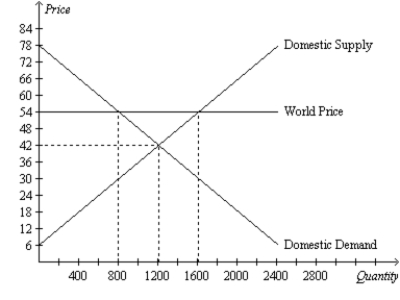 -Refer to Figure 9-12. Consumer surplus before trade is
(Multiple Choice)
4.8/5 (30)
Import quotas and tariffs produce some common results. Which of the following is not one of those common results?
(Multiple Choice)
4.9/5 (40)
Figure 9-10. The figure applies to Mexico and the good is rifles.
-Refer to Figure 9-10. The area bounded by the points Q0, P0), Q2, P1), and Q1, P1) represents
(Multiple Choice)
4.8/5 (37)
Tariffs cause deadweight loss because they move the price of an imported product closer to the equilibrium without trade, thus reducing the gains from trade.
(True/False)
4.8/5 (31)
Figure 9-28
The following diagram shows the domestic demand and domestic supply curves in a market. 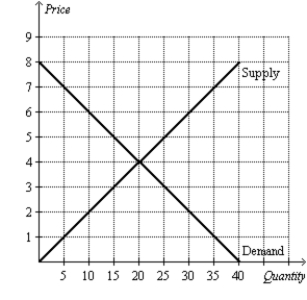 -Refer to Figure 9-28. With no trade allowed, what are the equilibrium price and equilibrium quantity in this market?
(Short Answer)
4.7/5 (35)
Figure 9-20
The figure illustrates the market for rice in Vietnam. 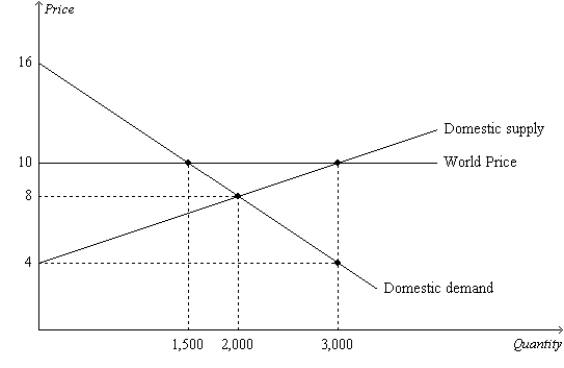 -Refer to Figure 9-20. With trade, Vietnamese rice producers will produce
(Multiple Choice)
4.8/5 (41)
Which of the following assertions is not correct about the multilateral approach to free trade?
(Multiple Choice)
4.9/5 (43)
Figure 9-8. On the diagram below, Q represents the quantity of cars and P represents the price of cars. 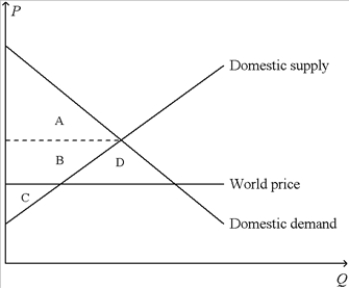 -Refer to Figure 9-8. The country for which the figure is drawn
(Multiple Choice)
4.9/5 (31)
Figure 9-6
The figure illustrates the market for roses in a country. 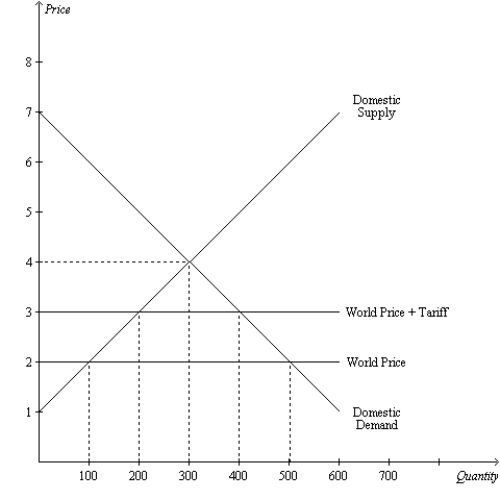 -Refer to Figure 9-6. Without trade, the equilibrium price of roses is
(Multiple Choice)
4.9/5 (35)
Suppose Ecuador imposes a tariff on imported bananas. If the increase in producer surplus is $50 million, the reduction in consumer surplus is $150 million, and the deadweight loss of the tariff is $30 million, then the tariff generates $130 million in revenue for the government.
(True/False)
4.8/5 (40)
Figure 9-27
The following diagram shows the domestic demand and supply curves in a market. Assume that the world price in this market is $20 per unit. 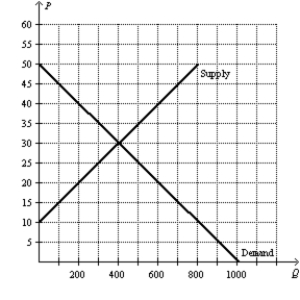 -Refer to Figure 9-27. If the country allows free trade, by how much do consumer surplus, producer surplus, and total surplus change with trade?
(Essay)
4.9/5 (29)
Import quotas and tariffs both cause the quantity of imports to fall.
(True/False)
5.0/5 (35)
Filters
- Essay(0)
- Multiple Choice(0)
- Short Answer(0)
- True False(0)
- Matching(0)