Exam 9: Application: International Trade
Exam 1: Ten Principles of Economics438 Questions
Exam 2: Thinking Like an Economist620 Questions
Exam 3: Interdependence and the Gains From Trade527 Questions
Exam 4: The Market Forces of Supply and Demand700 Questions
Exam 5: Elasticity and Its Application598 Questions
Exam 6: Supply, Demand, and Government Policies648 Questions
Exam 7: Consumers, Producers, and the Efficiency of Markets550 Questions
Exam 8: Application: The Costs of Taxation514 Questions
Exam 9: Application: International Trade496 Questions
Exam 10: Externalities522 Questions
Exam 11: Public Goods and Common Resources434 Questions
Exam 12: The Costs of Production420 Questions
Exam 13: Firms in Competitive Markets543 Questions
Exam 14: Monopoly637 Questions
Exam 15: Measuring a Nations Income522 Questions
Exam 16: Measuring the Cost of Living545 Questions
Exam 17: Production and Growth507 Questions
Exam 18: Saving, Investment, and the Financial System567 Questions
Exam 19: The Basic Tools of Finance513 Questions
Exam 20: Unemployment699 Questions
Exam 21: The Monetary System518 Questions
Exam 22: Money Growth and Inflation487 Questions
Exam 23: Aggregate Demand and Aggregate Supply563 Questions
Exam 24: The Influence of Monetary and Fiscal Policy on Aggregate Demand512 Questions
Select questions type
Honduras is an importer of goose-down pillows. The world price of these pillows is $50. Honduras imposes a $7 tariff on pillows. Honduras is a price-taker in the pillow market. As a result of the tariff, the price of goose-down pillows in Honduras
(Multiple Choice)
4.9/5  (40)
(40)
Scenario 9-2
• For a small country called Boxland, the equation of the domestic demand curve for cardboard is
 where
where

 represents the domestic quantity of cardboard demanded, in tons, and represents the price of a ton of cardboard.
• For Boxland, the equation of the domestic supply curve for cardboard is
represents the domestic quantity of cardboard demanded, in tons, and represents the price of a ton of cardboard.
• For Boxland, the equation of the domestic supply curve for cardboard is
 where
where

 represents the domestic quantity of cardboard supplied, in tons, and again represents the price of a ton of cardboard.
-Refer to Scenario 9-2. Suppose the world price of cardboard is $60. Then, relative to the no-trade situation, international trade in cardboard produces which of the following results for Boxland?
represents the domestic quantity of cardboard supplied, in tons, and again represents the price of a ton of cardboard.
-Refer to Scenario 9-2. Suppose the world price of cardboard is $60. Then, relative to the no-trade situation, international trade in cardboard produces which of the following results for Boxland?
(Multiple Choice)
4.9/5 (30)
Figure 9-28
The following diagram shows the domestic demand and domestic supply curves in a market. 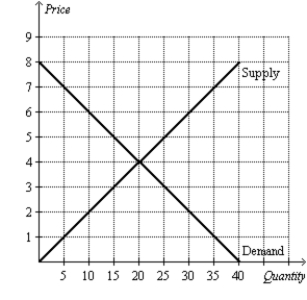 -Refer to Figure 9-28. Suppose the world price in this market is $6. If the country allows free trade, how much is consumer surplus?
(Short Answer)
5.0/5 (24)
Figure 9-9 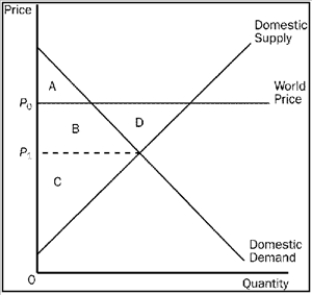 -Refer to Figure 9-9. Consumer surplus in this market after trade is
(Multiple Choice)
4.9/5 (32)
If a country allows trade and, for a certain good, the domestic price without trade is lower than the world price,
(Multiple Choice)
4.9/5 (38)
Suppose Ukraine subsidizes Ukrainian wheat farmers, while Russia offers no subsidy to Russian wheat farmers. As a result of the Ukrainian subsidy, sales of Ukrainian wheat to Russia
(Multiple Choice)
4.8/5 (38)
Figure 9-5
The figure illustrates the market for tricycles in a country. 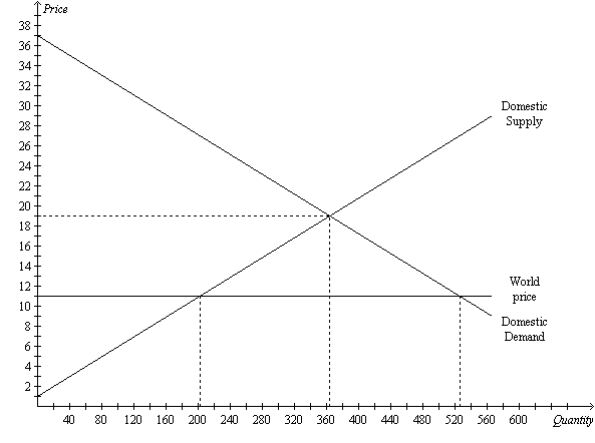 -Refer to Figure 9-5. Without trade, consumer surplus amounts to
(Multiple Choice)
4.9/5 (38)
The world price of a ton of steel is $1,000. Before Russia allowed trade in steel, the price of a ton of steel there was $650. Once Russia allowed trade in steel with other countries, Russia began
(Multiple Choice)
4.8/5 (38)
Scenario 9-3
Suppose domestic demand and domestic supply in a market are given by the following equations:  -Refer to Scenario 9-3. With no trade allowed, how much are consumer surplus, producer surplus, and total surplus in this market?
(Essay)
4.9/5 (31)
Figure 9-13 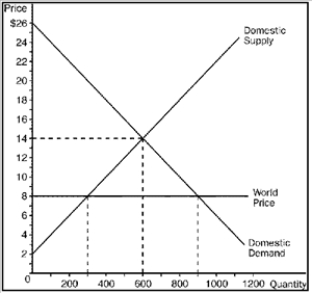 -Refer to Figure 9-13. Consumer surplus before trade is
(Multiple Choice)
4.8/5 (31)
When a country that imports a particular good imposes a tariff on that good,
(Multiple Choice)
5.0/5 (48)
Figure 9-8. On the diagram below, Q represents the quantity of cars and P represents the price of cars. 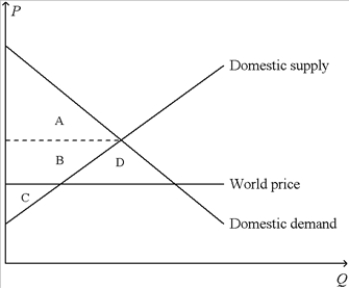 -Refer to Figure 9-8. In the country for which the figure is drawn, total surplus with international trade in cars
(Multiple Choice)
4.8/5 (39)
Figure 9-29
The following diagram shows the domestic demand and domestic supply curves in a market. Assume that the world price in this market is $1 per unit. 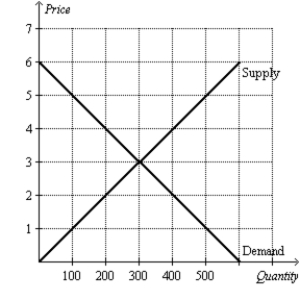 -Refer to Figure 9-29. Suppose the country imposes a $1 per unit tariff. If the country allows trade with a tariff, how many units will domestic consumers demand and how many units will domestic producers supply?
(Essay)
4.8/5 (40)
Figure 9-15 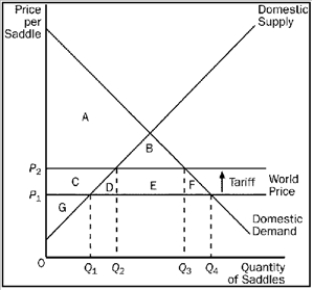 -Refer to Figure 9-15. A result of the tariff is that, relative to the free-trade situation, the quantity of saddles imported decreases by
(Multiple Choice)
4.9/5 (40)
Figure 9-25
The following diagram shows the domestic demand and supply in a market. Assume that the world price in this market is $10 per unit. 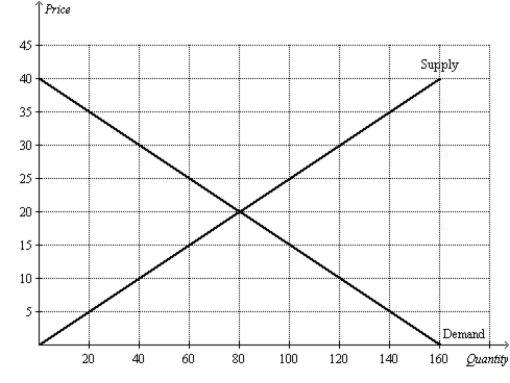 -Refer to Figure 9-25. Suppose the government imposes a tariff of $5 per unit. With trade and a tariff, total surplus is
(Multiple Choice)
4.8/5 (37)
If Honduras were to subsidize the production of wool blankets and sell them in Sweden at artificially low prices, the Swedish economy would be worse off.
(True/False)
4.8/5 (24)
If Belgium exports chocolate to the rest of the world, then Belgian chocolate producers benefit from higher producer surplus, Belgian chocolate consumers are worse off because of lower consumer surplus, and total surplus in Belgium increases because of the exports of chocolate.
(True/False)
4.8/5 (29)
When a country allows international trade and becomes an importer of a good,
(Multiple Choice)
4.9/5 (35)
Figure 9-29
The following diagram shows the domestic demand and domestic supply curves in a market. Assume that the world price in this market is $1 per unit.
-Refer to Figure 9-29. Suppose the country imposes a $1 per unit tariff. If the country allows trade with a tariff, how much is the deadweight loss caused by the tariff?
(Short Answer)
4.8/5 (45)
Filters
- Essay(0)
- Multiple Choice(0)
- Short Answer(0)
- True False(0)
- Matching(0)