Exam 9: Application: International Trade
Exam 1: Ten Principles of Economics438 Questions
Exam 2: Thinking Like an Economist620 Questions
Exam 3: Interdependence and the Gains From Trade527 Questions
Exam 4: The Market Forces of Supply and Demand700 Questions
Exam 5: Elasticity and Its Application598 Questions
Exam 6: Supply, Demand, and Government Policies648 Questions
Exam 7: Consumers, Producers, and the Efficiency of Markets550 Questions
Exam 8: Application: The Costs of Taxation514 Questions
Exam 9: Application: International Trade496 Questions
Exam 10: Externalities522 Questions
Exam 11: Public Goods and Common Resources434 Questions
Exam 12: The Costs of Production420 Questions
Exam 13: Firms in Competitive Markets543 Questions
Exam 14: Monopoly637 Questions
Exam 15: Measuring a Nations Income522 Questions
Exam 16: Measuring the Cost of Living545 Questions
Exam 17: Production and Growth507 Questions
Exam 18: Saving, Investment, and the Financial System567 Questions
Exam 19: The Basic Tools of Finance513 Questions
Exam 20: Unemployment699 Questions
Exam 21: The Monetary System518 Questions
Exam 22: Money Growth and Inflation487 Questions
Exam 23: Aggregate Demand and Aggregate Supply563 Questions
Exam 24: The Influence of Monetary and Fiscal Policy on Aggregate Demand512 Questions
Select questions type
When a government imposes a tariff on a product, the domestic price will equal the world price.
(True/False)
5.0/5  (28)
(28)
Figure 9-5
The figure illustrates the market for tricycles in a country. 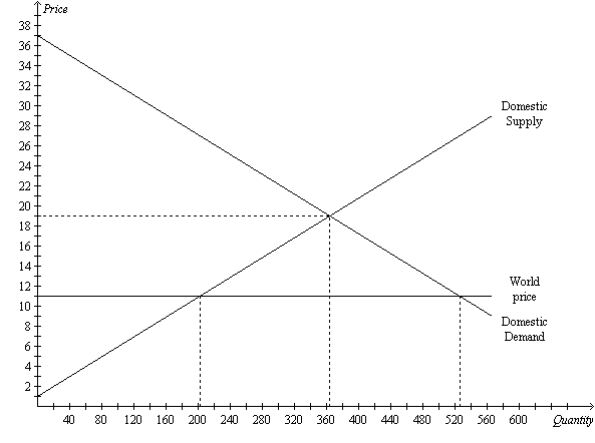 -Refer to Figure 9-5. With trade, this country
(Multiple Choice)
4.8/5 (38)
Trade enhances the economic well-being of a nation in the sense that
(Multiple Choice)
4.8/5 (30)
Figure 9-22
The following diagram shows the domestic demand and domestic supply in a market. In addition, assume that the world price in this market is $40 per unit. 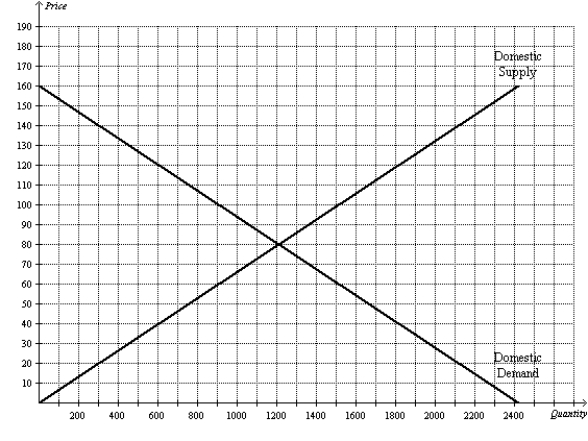 -Refer to Figure 9-22. Suppose the government imposes a tariff of $20 per unit. The deadweight loss caused by the tariff is
(Multiple Choice)
4.9/5 (37)
Figure 9-17 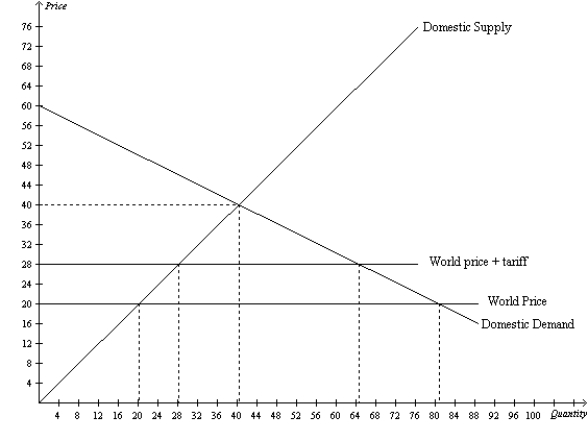 -Refer to Figure 9-17. With free trade, the country imports
(Multiple Choice)
4.7/5 (32)
Figure 9-26
The following diagram shows the domestic demand and domestic supply curves in a market.  -Refer to Figure 9-26. With no trade allowed, what are the equilibrium price and equilibrium quantity in this market?
(Essay)
4.9/5 (39)
For any country, if the world price of copper is lower than the domestic price of copper without trade, that country should
(Multiple Choice)
4.8/5 (37)
When a country that exported a particular good abandons a free-trade policy and adopts a no-trade policy,
(Multiple Choice)
4.8/5 (43)
Domestic producers of a good become better off, and domestic consumers of a good become worse off, when a country begins allowing international trade in that good and
(Multiple Choice)
4.8/5 (43)
The nation of Wheatland forbids international trade. In Wheatland, you can buy 1 pound of corn for 3 pounds of fish. In other countries, you can buy 1 pound of corn for 2 pounds of fish. These facts indicate that
(Multiple Choice)
4.9/5 (23)
"Owners of firms in young industries should be willing to incur temporary losses if they believe that those firms will be profitable in the long run." This observation helps to explain why many economists are skeptical about the
(Multiple Choice)
4.9/5 (43)
If the Korean steel industry subsidizes the steel that it sells to the United States, the
(Multiple Choice)
4.7/5 (30)
Figure 9-7. The figure applies to the nation of Wales and the good is cheese. 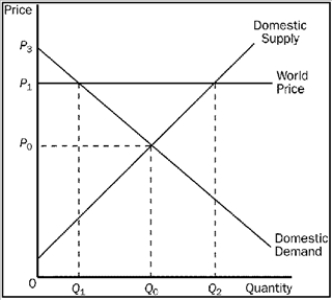 -Refer to Figure 9-7. Which of the following is a valid equation for Welsh consumer surplus with trade?
(Multiple Choice)
4.8/5 (42)
Figure 9-29
The following diagram shows the domestic demand and domestic supply curves in a market. Assume that the world price in this market is $1 per unit. 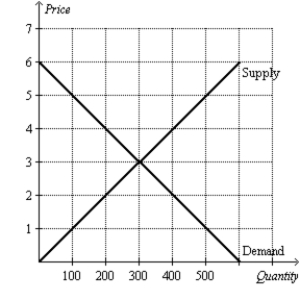 -Refer to Figure 9-29. If the country allows free trade, how much are consumer surplus, producer surplus, and total surplus with trade?
(Essay)
4.9/5 (41)
Figure 9-5
The figure illustrates the market for tricycles in a country.
-Refer to Figure 9-5. The increase in total surplus resulting from trade is
(Multiple Choice)
4.8/5 (39)
Figure 9-15 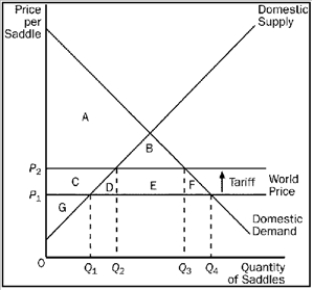 -Refer to Figure 9-15. Producer surplus with trade and without a tariff is
(Multiple Choice)
4.8/5 (42)
Figure 9-22
The following diagram shows the domestic demand and domestic supply in a market. In addition, assume that the world price in this market is $40 per unit.
-Refer to Figure 9-22. Suppose the government imposes a tariff of $20 per unit. The amount of revenue collected by the government from the tariff is
(Multiple Choice)
4.8/5 (30)
Figure 9-19. On the diagram below, Q represents the quantity of textiles and P represents the price of textiles. 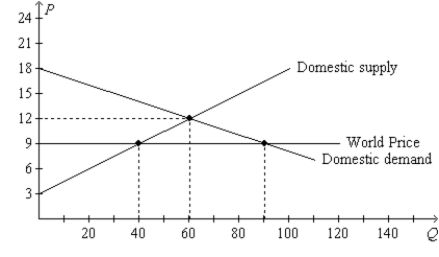 -Refer to Figure 9-19. With free trade, consumer surplus in the textile market amounts to
(Multiple Choice)
4.8/5 (41)
If a country's domestic price of a good is lower than the world price, then that country has a comparative advantage in producing that good.
(True/False)
4.8/5 (41)
Figure 9-12 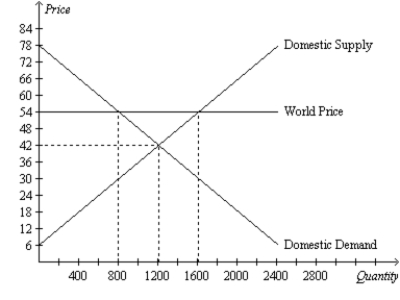 -Refer to Figure 9-12. Producer surplus before trade is
(Multiple Choice)
4.7/5 (32)
Filters
- Essay(0)
- Multiple Choice(0)
- Short Answer(0)
- True False(0)
- Matching(0)