Exam 9: Application: International Trade
Exam 1: Ten Principles of Economics438 Questions
Exam 2: Thinking Like an Economist620 Questions
Exam 3: Interdependence and the Gains From Trade527 Questions
Exam 4: The Market Forces of Supply and Demand700 Questions
Exam 5: Elasticity and Its Application598 Questions
Exam 6: Supply, Demand, and Government Policies648 Questions
Exam 7: Consumers, Producers, and the Efficiency of Markets550 Questions
Exam 8: Application: The Costs of Taxation514 Questions
Exam 9: Application: International Trade496 Questions
Exam 10: Externalities522 Questions
Exam 11: Public Goods and Common Resources434 Questions
Exam 12: The Costs of Production420 Questions
Exam 13: Firms in Competitive Markets543 Questions
Exam 14: Monopoly637 Questions
Exam 15: Measuring a Nations Income522 Questions
Exam 16: Measuring the Cost of Living545 Questions
Exam 17: Production and Growth507 Questions
Exam 18: Saving, Investment, and the Financial System567 Questions
Exam 19: The Basic Tools of Finance513 Questions
Exam 20: Unemployment699 Questions
Exam 21: The Monetary System518 Questions
Exam 22: Money Growth and Inflation487 Questions
Exam 23: Aggregate Demand and Aggregate Supply563 Questions
Exam 24: The Influence of Monetary and Fiscal Policy on Aggregate Demand512 Questions
Select questions type
Figure 9-1
The figure illustrates the market for coffee in Guatemala. 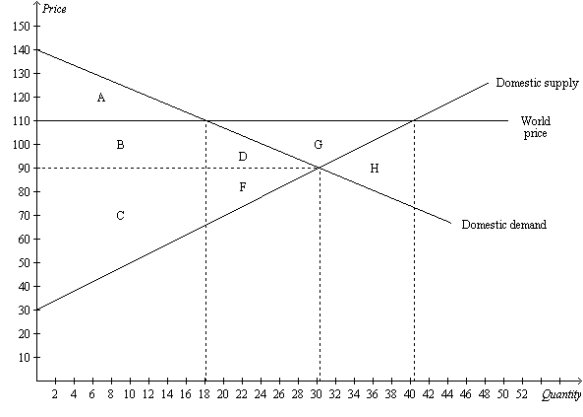 -Refer to Figure 9-1. With trade, Guatemala will
(Multiple Choice)
4.8/5  (39)
(39)
If Argentina exports oranges to the rest of the world, Argentina's producers of oranges are worse off, and Argentina's consumers of oranges are better off, as a result of trade.
(True/False)
4.8/5 (33)
Figure 9-1
The figure illustrates the market for coffee in Guatemala.
-Refer to Figure 9-1. When trade in coffee is allowed, consumer surplus in Guatemala
(Multiple Choice)
4.9/5 (33)
When a country allows trade and becomes an importer of a good,
(Multiple Choice)
4.9/5 (41)
Assume, for Japan, that the domestic price of automobiles without international trade is lower than the world price of automobiles. This suggests that, in the production of automobiles,
(Multiple Choice)
4.8/5 (39)
When a country abandons a no-trade policy, adopts a free-trade policy, and becomes an exporter of a particular good,
(Multiple Choice)
4.8/5 (49)
The United States has imposed taxes on some imported goods that have been sold here by foreign countries at below their cost of production. These taxes
(Multiple Choice)
4.8/5 (47)
Chile is an importer of computer chips, taking the world price of $12 per chip as given. Suppose Chile imposes a $7 tariff on chips. Which of the following outcomes is possible?
(Multiple Choice)
5.0/5 (37)
Deadweight loss measures the decrease in total surplus that results from a tariff or quota.
(True/False)
4.8/5 (38)
If the world price of coffee is lower than Colombia's domestic price of coffee without trade, then Colombia
(Multiple Choice)
4.9/5 (44)
Figure 9-6
The figure illustrates the market for roses in a country. 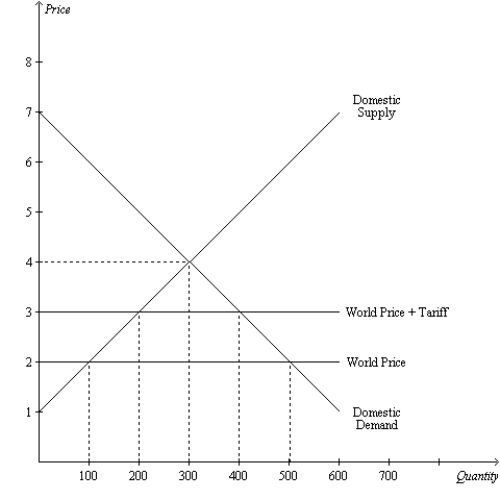 -Refer to Figure 9-6. Before the tariff is imposed, this country
(Multiple Choice)
4.9/5 (31)
Scenario 9-2
• For a small country called Boxland, the equation of the domestic demand curve for cardboard is
 where
where

 represents the domestic quantity of cardboard demanded, in tons, and represents the price of a ton of cardboard.
• For Boxland, the equation of the domestic supply curve for cardboard is
represents the domestic quantity of cardboard demanded, in tons, and represents the price of a ton of cardboard.
• For Boxland, the equation of the domestic supply curve for cardboard is
 where
where

 represents the domestic quantity of cardboard supplied, in tons, and again represents the price of a ton of cardboard.
-Refer to Scenario 9-2. Suppose the world price of cardboard is $45. Then, if Boxland goes from prohibiting international trade in cardboard to allowing international trade in cardboard,
represents the domestic quantity of cardboard supplied, in tons, and again represents the price of a ton of cardboard.
-Refer to Scenario 9-2. Suppose the world price of cardboard is $45. Then, if Boxland goes from prohibiting international trade in cardboard to allowing international trade in cardboard,
(Multiple Choice)
4.9/5 (42)
Figure 9-11 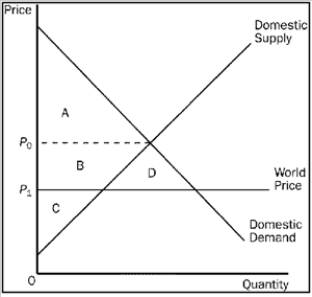 -Refer to Figure 9-11. Consumer surplus in this market before trade is
(Multiple Choice)
4.7/5 (35)
Figure 9-29
The following diagram shows the domestic demand and domestic supply curves in a market. Assume that the world price in this market is $1 per unit. 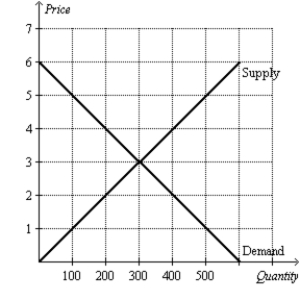 -Refer to Figure 9-29. If the country allows free trade, will the country import or export this good, and how many units will be imported/exported?
(Short Answer)
4.9/5 (33)
Figure 9-5
The figure illustrates the market for tricycles in a country. 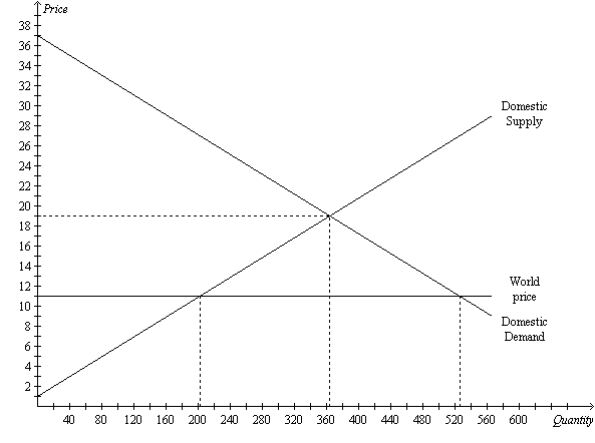 -Refer to Figure 9-5. With trade, consumer surplus is
(Multiple Choice)
4.9/5 (42)
Scenario 9-1
The before-trade domestic price of peaches in the United States is $40 per bushel. The world price of peaches is
$52 per bushel. The U.S. is a price-taker in the market for peaches.
-Refer to Scenario 9-1. If trade in peaches is allowed, the
(Multiple Choice)
4.8/5 (35)
Scenario 9-2
• For a small country called Boxland, the equation of the domestic demand curve for cardboard is
where
represents the domestic quantity of cardboard demanded, in tons, and represents the price of a ton of cardboard.
• For Boxland, the equation of the domestic supply curve for cardboard is
where
represents the domestic quantity of cardboard supplied, in tons, and again represents the price of a ton of cardboard.
-Refer to Scenario 9-2. Suppose the world price of cardboard is $60. Then, if Boxland goes from prohibiting international trade in cardboard to allowing international trade in cardboard,
(Multiple Choice)
4.8/5 (32)
The General Agreement on Tariffs and Trade GATT) was initiated in response to
(Multiple Choice)
4.9/5 (35)
Figure 9-24
The following diagram shows the domestic demand and supply in a market. Assume that the world price in this market is $20 per unit. 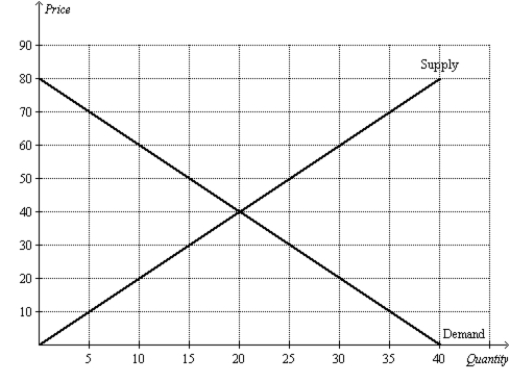 -Refer to Figure 9-24. Suppose the government imposes a tariff of $10 per unit. The deadweight loss caused by the tariff is
(Multiple Choice)
4.9/5 (37)
Filters
- Essay(0)
- Multiple Choice(0)
- Short Answer(0)
- True False(0)
- Matching(0)