Exam 13: Aggregate Expenditures
Exam 1: Economics: The World Around You90 Questions
Exam 2: Choice, Opportunity Costs, and Specialization94 Questions
Exam 3: Markets, Demand and Supply, and the Price System97 Questions
Exam 5: The Market System and the Private and Public Sector97 Questions
Exam 4: Elasticity: Demand and Supply126 Questions
Exam 6: National Income Accounting104 Questions
Exam 7: an Introduction to the Foreign Exchange Market and the Balance of Payments90 Questions
Exam 8: Consumer Choice132 Questions
Exam 9: Supply: The Costs of Doing Business106 Questions
Exam 10: Unemployment and Inflation129 Questions
Exam 11: Macroeconomic Equilibrium: Aggregate Demand and Supply122 Questions
Exam 12: Profit Maximization122 Questions
Exam 13: Aggregate Expenditures115 Questions
Exam 14: Perfect Competition135 Questions
Exam 15: Income and Expenditures Equilibrium134 Questions
Exam 16: Monopoly118 Questions
Exam 17: Fiscal Policy93 Questions
Exam 18: Monopolistic Competition and Oligopoly111 Questions
Exam 19: Antitrust and Regulation100 Questions
Exam 10: Money and Banking125 Questions
Exam 21: Market Failures, Government Failures, and Rent Seeking121 Questions
Exam 22: Monetary Policy141 Questions
Exam 23: Macroeconomic Policy: Tradeoffs, Expectations, Credibility, and Sources of Business Cycles112 Questions
Exam 24: Resource Markets112 Questions
Exam 25: Macroeconomic Viewpoints: New Keynesian, Monetarist, and New Classical99 Questions
Exam 26: The Labor Market114 Questions
Exam 27: Capital Markets100 Questions
Exam 28: Economic Growth99 Questions
Exam 29: Development Economics104 Questions
Exam 30: the Land Market and Natural Resources55 Questions
Exam 31: Aging, Social Security and Health Care88 Questions
Exam 32: Globalization84 Questions
Exam 33: Elasticity: Demand and Supply126 Questions
Exam 34: Income Distribution, Poverty and Government Policy115 Questions
Exam 35: World Trade Equilibrium112 Questions
Exam 36: Consumer Choice132 Questions
Exam 37: International Trade Restrictions109 Questions
Exam 38: World Trade Equilibrium112 Questions
Exam 39: Exchange Rates and Financial Links Between Countries132 Questions
Exam 40: International Trade Restrictions109 Questions
Exam 41: Supply: the Costs of Doing Business106 Questions
Exam 42: Exchange Rates and Financial Links Between Countries132 Questions
Exam 43: Profit Maximization122 Questions
Exam 44: Perfect Competition135 Questions
Exam 45: Monopoly118 Questions
Exam 46: Monopolistic Competition and Oligopoly111 Questions
Exam 47: Antitrust and Regulation100 Questions
Exam 48: Market Failures, Government Failures, and Rent Seeking121 Questions
Exam 49: Resource Markets112 Questions
Exam 50: The Labor Market114 Questions
Exam 51: Capital Markets100 Questions
Exam 52: The Land Market and Natural Resources55 Questions
Exam 53: Aging, Social Security and Health Care87 Questions
Exam 54: Income Distribution, Poverty and Government Policy115 Questions
Exam 55: World Trade Equilibrium112 Questions
Exam 56: International Trade Restrictions109 Questions
Exam 57: Exchange Rates and Financial Links Between Countries132 Questions
Select questions type
The figure given below represents the saving function of an economy. Figure 9.1 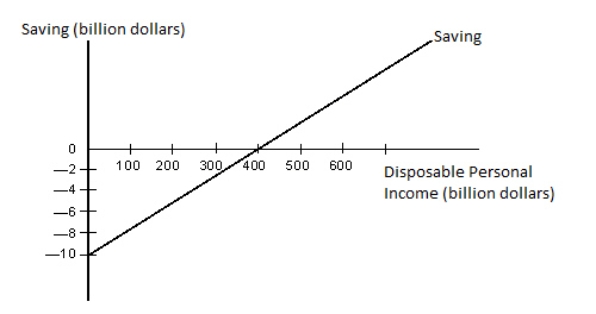 Refer to Figure 9.1.At the real GDP level of $400 billion, which of the following statements is true?
(Multiple Choice)
4.8/5  (45)
(45)
Table 9.2  Refer to Table 9.2.If a firm purchases the machine by taking out a one-year loan, what happens to the firm's rate of return on the investment if the interest rate increases to 10 percent?
(Multiple Choice)
5.0/5 (41)
The figure given below represents the saving function of an economy. Figure 9.1  Refer to Figure 9.1.Which of the following statements is true for real GDP levels below $400 billion?
(Multiple Choice)
4.8/5 (30)
The figure given below represents the consumption function of a country. Figure 9.3 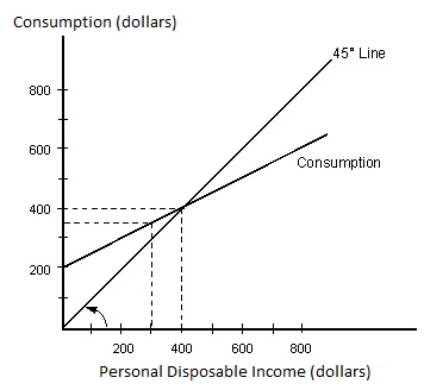 Refer to Figure 9.3.If the marginal propensity to consume is equal to 0.3, then:
(Multiple Choice)
4.9/5 (34)
The net export function is negatively sloped because exports are inversely related to domestic income.
(True/False)
4.7/5 (46)
Once macroeconomic equilibrium has been established in an economy, there is no tendency for real GDP to change, even if there is a change in autonomous expenditure.
(True/False)
4.9/5 (32)
Identify the correct statement with respect to consumption and saving function.
(Multiple Choice)
4.8/5 (49)
The 45-degree line used in a consumption function represents:
(Multiple Choice)
4.8/5 (40)
In the table given below Y represent the aggregate expenditure of the economy on C = consumption, I = investment, G = government projects, and X = net exports. Table 9.3
 Refer to Table 9.3.At an income level of $300, the average propensity to save equals:
(Multiple Choice)
4.9/5 (32)
The marginal propensity to consume (MPC)is equal to the inverse of the marginal propensity to save (MPS).
(True/False)
4.9/5 (28)
The table given below reports the consumption expenditure of a nation at different levels of disposable income. Table 9.1
 Refer to Table 9.1.The income level of $18, 000 coincides with:
(Multiple Choice)
4.8/5 (40)
Suppose the marginal propensity to import for country A is 0.4.Calculate the change in total value of imports of the country if national income increases by $100, 000.
(Multiple Choice)
4.9/5 (37)
Other things equal, when Europeans want to buy more grain from the United States:
(Multiple Choice)
4.8/5 (41)
When government spending is added to consumption and planned investment, the slope of the aggregate expenditure function increases.
(True/False)
4.8/5 (37)
The figure given below represents the saving function of an economy. Figure 9.1  Refer to Figure 9.1.When disposable income equals zero:
(Multiple Choice)
5.0/5 (40)
Suppose that the U.S.trade balance is positive.Hence, when the net export function is added to C+I+G, the slope of the U.S.aggregate expenditures function will become steeper.
(True/False)
4.9/5 (40)
Filters
- Essay(0)
- Multiple Choice(0)
- Short Answer(0)
- True False(0)
- Matching(0)