Exam 13: Aggregate Expenditures
Exam 1: Economics: The World Around You90 Questions
Exam 2: Choice, Opportunity Costs, and Specialization94 Questions
Exam 3: Markets, Demand and Supply, and the Price System97 Questions
Exam 5: The Market System and the Private and Public Sector97 Questions
Exam 4: Elasticity: Demand and Supply126 Questions
Exam 6: National Income Accounting104 Questions
Exam 7: an Introduction to the Foreign Exchange Market and the Balance of Payments90 Questions
Exam 8: Consumer Choice132 Questions
Exam 9: Supply: The Costs of Doing Business106 Questions
Exam 10: Unemployment and Inflation129 Questions
Exam 11: Macroeconomic Equilibrium: Aggregate Demand and Supply122 Questions
Exam 12: Profit Maximization122 Questions
Exam 13: Aggregate Expenditures115 Questions
Exam 14: Perfect Competition135 Questions
Exam 15: Income and Expenditures Equilibrium134 Questions
Exam 16: Monopoly118 Questions
Exam 17: Fiscal Policy93 Questions
Exam 18: Monopolistic Competition and Oligopoly111 Questions
Exam 19: Antitrust and Regulation100 Questions
Exam 10: Money and Banking125 Questions
Exam 21: Market Failures, Government Failures, and Rent Seeking121 Questions
Exam 22: Monetary Policy141 Questions
Exam 23: Macroeconomic Policy: Tradeoffs, Expectations, Credibility, and Sources of Business Cycles112 Questions
Exam 24: Resource Markets112 Questions
Exam 25: Macroeconomic Viewpoints: New Keynesian, Monetarist, and New Classical99 Questions
Exam 26: The Labor Market114 Questions
Exam 27: Capital Markets100 Questions
Exam 28: Economic Growth99 Questions
Exam 29: Development Economics104 Questions
Exam 30: the Land Market and Natural Resources55 Questions
Exam 31: Aging, Social Security and Health Care88 Questions
Exam 32: Globalization84 Questions
Exam 33: Elasticity: Demand and Supply126 Questions
Exam 34: Income Distribution, Poverty and Government Policy115 Questions
Exam 35: World Trade Equilibrium112 Questions
Exam 36: Consumer Choice132 Questions
Exam 37: International Trade Restrictions109 Questions
Exam 38: World Trade Equilibrium112 Questions
Exam 39: Exchange Rates and Financial Links Between Countries132 Questions
Exam 40: International Trade Restrictions109 Questions
Exam 41: Supply: the Costs of Doing Business106 Questions
Exam 42: Exchange Rates and Financial Links Between Countries132 Questions
Exam 43: Profit Maximization122 Questions
Exam 44: Perfect Competition135 Questions
Exam 45: Monopoly118 Questions
Exam 46: Monopolistic Competition and Oligopoly111 Questions
Exam 47: Antitrust and Regulation100 Questions
Exam 48: Market Failures, Government Failures, and Rent Seeking121 Questions
Exam 49: Resource Markets112 Questions
Exam 50: The Labor Market114 Questions
Exam 51: Capital Markets100 Questions
Exam 52: The Land Market and Natural Resources55 Questions
Exam 53: Aging, Social Security and Health Care87 Questions
Exam 54: Income Distribution, Poverty and Government Policy115 Questions
Exam 55: World Trade Equilibrium112 Questions
Exam 56: International Trade Restrictions109 Questions
Exam 57: Exchange Rates and Financial Links Between Countries132 Questions
Select questions type
The table given below reports the consumption expenditure of a nation at different levels of disposable income. Table 9.1
 Refer to Table 9.1.When disposable income is $20, 000, consumption spending equals:
Free
(Multiple Choice)
4.7/5  (43)
(43)
Correct Answer: Verified
D
Dissaving occurs when the consumption function lies belowthe 45-degree line.
Free
(True/False)
4.9/5 (33)
Correct Answer:Verified
False
The average propensity to save (APS)is the proportion of disposable income that is saved.
Free
(True/False)
4.8/5 (35)
Correct Answer:Verified
True
The figure given below shows the consumption functions of an economy. Figure 9.4 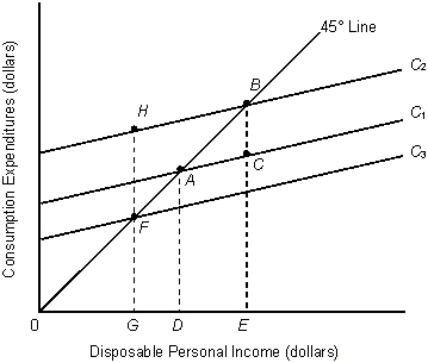 Refer to Figure 9.4.Which of the following could explain a downward shift of the consumption function from C1 to C3?
(Multiple Choice)
4.8/5 (32)
Which of the following will cause the investment function to shift upward?
(Multiple Choice)
4.8/5 (39)
Suppose that the consumption function crosses the 45-degree line at a disposable income level of $800.Assume further that saving equals $200 when disposable income is $1, 300.This implies that the MPC must equal 0.6.
(True/False)
4.8/5 (32)
In the table given below Y represent the aggregate expenditure of the economy on C = consumption, I = investment, G = government projects, and X = net exports. Table 9.3
 Refer to Table 9.3.Compute the marginal propensity to save in the economy.
(Multiple Choice)
4.8/5 (40)
The figure given below represents the saving function of an economy. Figure 9.1 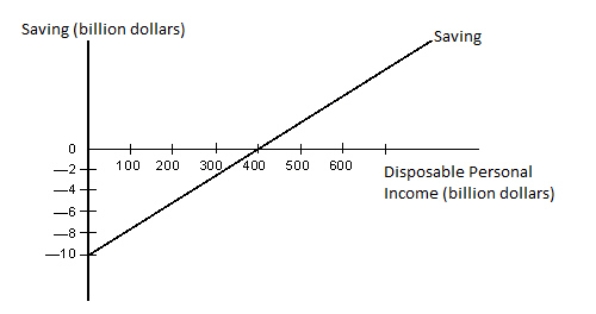 Refer to Figure 9.1.An increase in autonomous consumption would be illustrated by:
(Multiple Choice)
4.8/5 (42)
MPI refers to the percentage of additional domestic income spent on imports.
(True/False)
4.7/5 (27)
Which of the following is least likely to contribute to the volatility of investment spending?
(Multiple Choice)
4.8/5 (36)
The table given below reports the consumption expenditure of a nation at different levels of disposable income. Table 9.1
 Refer to Table 9.1.At an income level of $10, 000, the APS equals -0.20.Therefore, the APC has to equal:
(Multiple Choice)
4.7/5 (36)
If it is assumed that there are absolutely no taxes in an economy, then aggregate consumption will be drawn as a function of:
(Multiple Choice)
5.0/5 (38)
The figure given below shows the aggregate expenditures function of an economy. Figure 9.5 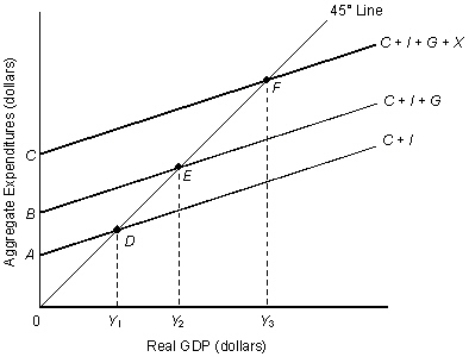 Refer to Figure 9.5.The amount of government spending is indicated by the distance _____.
(Multiple Choice)
4.8/5 (36)
What would be the impact of an increase in foreign income on the net export function?
(Multiple Choice)
4.7/5 (47)
Other things equal, a marginal propensity to import of 0.8 implies that a $100 million increase in domestic income will lead to an $80 million decrease in net exports.
(True/False)
4.7/5 (31)
Changes in autonomous consumption will affect the slope of the consumption function.
(True/False)
4.8/5 (36)
Filters
- Essay(0)
- Multiple Choice(0)
- Short Answer(0)
- True False(0)
- Matching(0)