Exam 13: Aggregate Expenditures
Exam 1: Economics: The World Around You90 Questions
Exam 2: Choice, Opportunity Costs, and Specialization94 Questions
Exam 3: Markets, Demand and Supply, and the Price System97 Questions
Exam 5: The Market System and the Private and Public Sector97 Questions
Exam 4: Elasticity: Demand and Supply126 Questions
Exam 6: National Income Accounting104 Questions
Exam 7: an Introduction to the Foreign Exchange Market and the Balance of Payments90 Questions
Exam 8: Consumer Choice132 Questions
Exam 9: Supply: The Costs of Doing Business106 Questions
Exam 10: Unemployment and Inflation129 Questions
Exam 11: Macroeconomic Equilibrium: Aggregate Demand and Supply122 Questions
Exam 12: Profit Maximization122 Questions
Exam 13: Aggregate Expenditures115 Questions
Exam 14: Perfect Competition135 Questions
Exam 15: Income and Expenditures Equilibrium134 Questions
Exam 16: Monopoly118 Questions
Exam 17: Fiscal Policy93 Questions
Exam 18: Monopolistic Competition and Oligopoly111 Questions
Exam 19: Antitrust and Regulation100 Questions
Exam 10: Money and Banking125 Questions
Exam 21: Market Failures, Government Failures, and Rent Seeking121 Questions
Exam 22: Monetary Policy141 Questions
Exam 23: Macroeconomic Policy: Tradeoffs, Expectations, Credibility, and Sources of Business Cycles112 Questions
Exam 24: Resource Markets112 Questions
Exam 25: Macroeconomic Viewpoints: New Keynesian, Monetarist, and New Classical99 Questions
Exam 26: The Labor Market114 Questions
Exam 27: Capital Markets100 Questions
Exam 28: Economic Growth99 Questions
Exam 29: Development Economics104 Questions
Exam 30: the Land Market and Natural Resources55 Questions
Exam 31: Aging, Social Security and Health Care88 Questions
Exam 32: Globalization84 Questions
Exam 33: Elasticity: Demand and Supply126 Questions
Exam 34: Income Distribution, Poverty and Government Policy115 Questions
Exam 35: World Trade Equilibrium112 Questions
Exam 36: Consumer Choice132 Questions
Exam 37: International Trade Restrictions109 Questions
Exam 38: World Trade Equilibrium112 Questions
Exam 39: Exchange Rates and Financial Links Between Countries132 Questions
Exam 40: International Trade Restrictions109 Questions
Exam 41: Supply: the Costs of Doing Business106 Questions
Exam 42: Exchange Rates and Financial Links Between Countries132 Questions
Exam 43: Profit Maximization122 Questions
Exam 44: Perfect Competition135 Questions
Exam 45: Monopoly118 Questions
Exam 46: Monopolistic Competition and Oligopoly111 Questions
Exam 47: Antitrust and Regulation100 Questions
Exam 48: Market Failures, Government Failures, and Rent Seeking121 Questions
Exam 49: Resource Markets112 Questions
Exam 50: The Labor Market114 Questions
Exam 51: Capital Markets100 Questions
Exam 52: The Land Market and Natural Resources55 Questions
Exam 53: Aging, Social Security and Health Care87 Questions
Exam 54: Income Distribution, Poverty and Government Policy115 Questions
Exam 55: World Trade Equilibrium112 Questions
Exam 56: International Trade Restrictions109 Questions
Exam 57: Exchange Rates and Financial Links Between Countries132 Questions
Select questions type
An increase in disposable income will cause autonomous consumption to rise.
(True/False)
4.7/5  (48)
(48)
Economists have proved that a substantial increase in income during a month does not affect consumption much in the short run unless it is perceived as a permanent increase.
(True/False)
4.9/5 (33)
The slope of the aggregate expenditures function (AE)is flatter than the C+I+G function because:
(Multiple Choice)
4.8/5 (36)
The amount of autonomous consumption in an economy is measured by the:
(Multiple Choice)
4.8/5 (38)
The figure given below shows the consumption function of a household. Figure 9.2 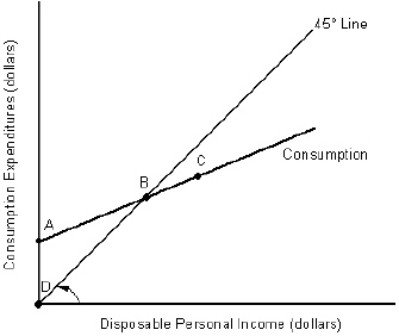 In Figure 9.2, the line segment AD represents:
(Multiple Choice)
4.9/5 (42)
Which of the following is true of long-run consumption functions?
(Multiple Choice)
4.9/5 (34)
The figure given below shows the consumption function of a household. Figure 9.2  In Figure 9.2, at any point to the left of point B:
(Multiple Choice)
4.8/5 (37)
In the table given below Y represent the aggregate expenditure of the economy on C = consumption, I = investment, G = government projects, and X = net exports. Table 9.3
 According to Table 9.3, what is the marginal propensity to import?
(Multiple Choice)
4.9/5 (40)
The table given below reports the consumption expenditure of a nation at different levels of disposable income. Table 9.1
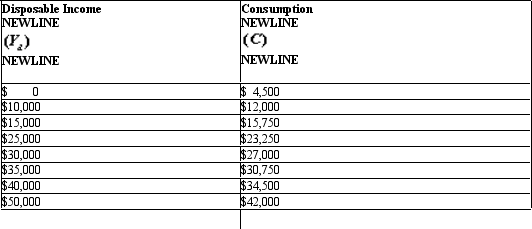 Refer to Table 9.1.At an income level of $45, 000, the average propensity to save would equal:
(Multiple Choice)
4.8/5 (29)
Consumption, saving, and wealth all represent stock concepts because they are measured over a period of time.
(True/False)
4.8/5 (37)
In the table given below Y represent the aggregate expenditure of the economy on C = consumption, I = investment, G = government projects, and X = net exports. Table 9.3
 Refer to Table 9.3.Calculate the marginal propensity to consume in the economy.
(Multiple Choice)
4.8/5 (31)
The table given below reports the consumption expenditure of a nation at different levels of disposable income. Table 9.1
 Refer to Table 9.1.Autonomous consumption expenditure in this nation will equal:
(Multiple Choice)
4.8/5 (45)
Table 9.2  Refer to Table 9.2.If a firm purchases the machine by taking out a one-year loan, what is the firm's profit from the investment?
(Multiple Choice)
4.8/5 (38)
The figure given below represents the consumption function of a country. Figure 9.3 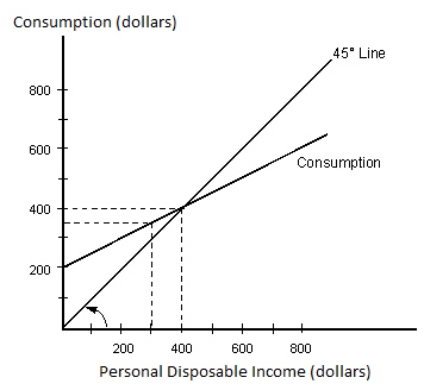 According to Figure 9.3, saving is zero when disposable income is _____.
(Multiple Choice)
4.8/5 (42)
Other things equal, when the U.S.dollar depreciates, domestic exports rise at every level of domestic income.
(True/False)
4.8/5 (39)
Other things equal, a decrease in the cost of capital would be associated with an upward shift of the investment function and, hence, with a rise in aggregate expenditures.
(True/False)
4.9/5 (43)
Which of the following variables do not change autonomous consumption?
(Multiple Choice)
4.8/5 (41)
Filters
- Essay(0)
- Multiple Choice(0)
- Short Answer(0)
- True False(0)
- Matching(0)