Exam 5: Elasticity and Its Application
Exam 1: Ten Principles of Economics438 Questions
Exam 2: Thinking Like an Economist620 Questions
Exam 3: Interdependence and the Gains From Trade527 Questions
Exam 4: The Market Forces of Supply and Demand700 Questions
Exam 5: Elasticity and Its Application598 Questions
Exam 6: Supply, Demand, and Government Policies648 Questions
Exam 7: Consumers, Producers, and the Efficiency of Markets547 Questions
Exam 8: Application: the Costs of Taxation514 Questions
Exam 9: Application: International Trade496 Questions
Exam 10: Measuring a Nations Income522 Questions
Exam 11: Measuring the Cost of Living545 Questions
Exam 12: Production and Growth507 Questions
Exam 13: Saving, Investment, and the Financial System567 Questions
Exam 14: The Basic Tools of Finance513 Questions
Exam 15: Unemployment699 Questions
Exam 16: The Monetary System517 Questions
Exam 17: Money Growth and Inflation487 Questions
Exam 18: Open-Economy Macroeconomics: Basic Concepts522 Questions
Exam 19: A Macroeconomic Theory of the Open Economy484 Questions
Exam 20: Aggregate Demand and Aggregate Supply563 Questions
Exam 21: The Influence of Monetary and Fiscal Policy on Aggregate Demand511 Questions
Exam 22: The Short-Run Trade-Off Between Inflation and Unemployment516 Questions
Exam 23: Six Debates Over Macroeconomic Policy372 Questions
Select questions type
Suppose demand is perfectly elastic, and the supply of the good in question decreases. As a result,
(Multiple Choice)
4.9/5  (29)
(29)
If a firm is facing inelastic demand, then the firm should decrease price to increase revenue.
(True/False)
4.7/5 (35)
Which of the following statements about the price elasticity of demand is correct?
(Multiple Choice)
4.9/5 (42)
Consider the following pairs of goods. For which of the two goods would you expect the demand to be more price elastic? Why?
a. water or diamonds
b. insulin or nasal decongestant spray
c. food in general or breakfast cereal
d. gasoline over the course of a week or gasoline over the course of a year
e. personal computers or IBM personal computers
(Essay)
4.8/5 (30)
If soybean farmers know that the demand for soybeans is inelastic, in order to increase their total revenues they should
(Multiple Choice)
4.8/5 (33)
A discovery that increases wheat yields per acre hurts farmers by increasing supply and lowering their total revenues.
(True/False)
4.8/5 (42)
The price elasticity of demand is defined as the percentage change in price divided by the percentage change in quantity demanded.
(True/False)
4.9/5 (35)
If the cross-price elasticity of demand for two goods is negative, then the two goods are substitutes.
(True/False)
4.7/5 (32)
If the price elasticity of demand is equal to 1, then demand is unit elastic.
(True/False)
4.8/5 (26)
Charles purchases 20 basketball tickets per year when his annual income is $50,000 and 25 basketball tickets when his annual income is $60,000. Charles's income elasticity of demand for basketball ticket is
(Multiple Choice)
4.8/5 (32)
 -Refer to Table 5-12. Between which two quantities listed is demand unit elastic?
(Essay)
4.8/5 (32)
Figure 5-20 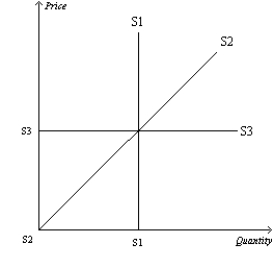 -Refer to Figure 5-20. Which supply curve is most likely relevant over a very long period of time?
(Multiple Choice)
4.9/5 (35)
Figure 5-4 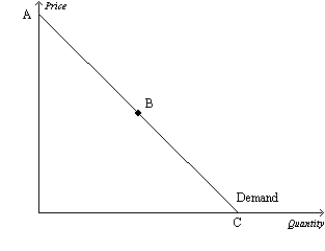 -Refer to Figure 5-4. If the price decreases in the region of the demand curve between points B and C, we can expect total revenue to
(Multiple Choice)
4.8/5 (35)
If the price elasticity of demand for a good is 0.2, then a 3 percent decrease in price results in a
(Multiple Choice)
4.9/5 (31)
-Refer to Table 5-12. Using the midpoint method, what is the price elasticity of demand between $2 and $4?
(Essay)
4.9/5 (36)
If demand is perfectly inelastic, the demand curve is vertical, and the price elasticity of demand equals 0.
(True/False)
4.9/5 (44)
Figure 5-15 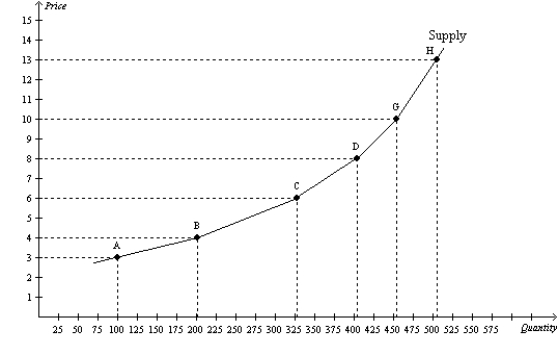 -Refer to Figure 5-15. Using the midpoint method, what is the price elasticity of supply between points C and D?
(Multiple Choice)
4.8/5 (28)
When the price of good A is $50, the quantity demanded of good A is 500 units. When the price of good A rises to $70, the quantity demanded of good A falls to 400 units. Using the midpoint method, the price elasticity of demand for good A is
(Multiple Choice)
4.8/5 (44)
Frequently, in the short run, the quantity supplied of a good is
(Multiple Choice)
4.8/5 (38)
Table 5-7
The following table shows a portion of the demand schedule for a particular good at various levels of income.
 -Refer to Table 5-7. Using the midpoint method, when income equals $7,500, what is the price elasticity of demand between $16 and $20?
(Multiple Choice)
4.9/5 (29)
Filters
- Essay(0)
- Multiple Choice(0)
- Short Answer(0)
- True False(0)
- Matching(0)