Exam 5: Elasticity and Its Application
Exam 1: Ten Principles of Economics438 Questions
Exam 2: Thinking Like an Economist620 Questions
Exam 3: Interdependence and the Gains From Trade527 Questions
Exam 4: The Market Forces of Supply and Demand700 Questions
Exam 5: Elasticity and Its Application598 Questions
Exam 6: Supply, Demand, and Government Policies648 Questions
Exam 7: Consumers, Producers, and the Efficiency of Markets547 Questions
Exam 8: Application: the Costs of Taxation514 Questions
Exam 9: Application: International Trade496 Questions
Exam 10: Measuring a Nations Income522 Questions
Exam 11: Measuring the Cost of Living545 Questions
Exam 12: Production and Growth507 Questions
Exam 13: Saving, Investment, and the Financial System567 Questions
Exam 14: The Basic Tools of Finance513 Questions
Exam 15: Unemployment699 Questions
Exam 16: The Monetary System517 Questions
Exam 17: Money Growth and Inflation487 Questions
Exam 18: Open-Economy Macroeconomics: Basic Concepts522 Questions
Exam 19: A Macroeconomic Theory of the Open Economy484 Questions
Exam 20: Aggregate Demand and Aggregate Supply563 Questions
Exam 21: The Influence of Monetary and Fiscal Policy on Aggregate Demand511 Questions
Exam 22: The Short-Run Trade-Off Between Inflation and Unemployment516 Questions
Exam 23: Six Debates Over Macroeconomic Policy372 Questions
Select questions type
Table 5-3
Consider the following demand schedule.
 -Refer to Table 5-3. Using the midpoint method, in which range is demand most elastic?
(Multiple Choice)
4.8/5  (28)
(28)
Figure 5-21 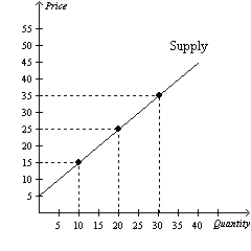 -Refer to Figure 5-21. Using the midpoint method, what is the price elasticity of supply between $15 and $25?
(Essay)
4.8/5 (46)
Suppose the income elasticity of demand is -0.5 for good X. This implies that a 5% decrease in income will cause the quantity demanded of good X to
(Multiple Choice)
4.8/5 (31)
Generally, a firm is more willing and able to increase quantity supplied in response to a price change when
(Multiple Choice)
4.8/5 (32)
Figure 5-10 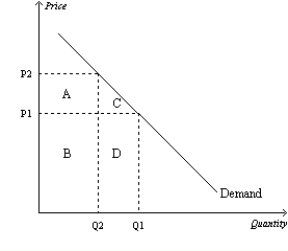 -Refer to Figure 5-10. Total revenue when the price is P1 is represented by the areas)
(Multiple Choice)
4.9/5 (39)
Figure 5-4 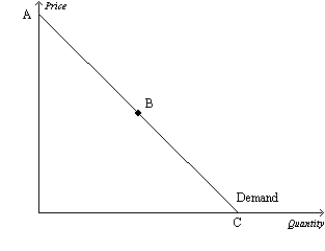 -Refer to Figure 5-4. If the price decreases in the region of the demand curve between points A and B, we can expect total revenue to
(Multiple Choice)
4.8/5 (37)
When the Shaffers had a monthly income of $4,000, they usually ate out 8 times a month. Now that the couple makes $4,500 a month, they eat out 10 times a month. Compute the couple's income elasticity of demand using the midpoint method. Explain your answer. Is a restaurant meal a normal or inferior good to the couple?
(Essay)
4.7/5 (40)
If sellers do not adjust their quantity supplied at all in response to a change in price, the price elasticity of supply is
(Multiple Choice)
4.9/5 (31)
Figure 5-4
-Refer to Figure 5-4. If the price increases in the region of the demand curve between points A and B, we can expect total revenue to
(Multiple Choice)
4.8/5 (33)
Figure 5-4
-Refer to Figure 5-4. The section of the demand curve at point B represents the
(Multiple Choice)
4.9/5 (29)
As we move downward and to the right along a linear, downward-sloping demand curve,
(Multiple Choice)
4.9/5 (42)
The demand for desserts tends to be more inelastic than the demand for red velvet cake.
(True/False)
4.9/5 (27)
Scenario 5-8
Consider the markets for mobile and landline telephone service. Suppose that when the average income of residents of Plainville is $55,000 per year, the quantity demanded of landline telephone service is 12,500 and the quantity demanded of mobile service is 28,000. Suppose that when the price of mobile service rises from $100 to $120 per month, the quantity demanded of landline service decreases to 11,000. Suppose also that when the average income increases to $60,000, the quantity demanded of mobile service increases to 33,000.
-Refer to Scenario 5-8. Using the midpoint method, what is the cross price elasticity of demand for landline and mobile service?
(Essay)
4.9/5 (34)
Table 5-7
The following table shows a portion of the demand schedule for a particular good at various levels of income.
 -Refer to Table 5-7. Using the midpoint method, at a price of $12, what is the income elasticity of demand when income rises from $5,000 to $10,000?
(Multiple Choice)
4.9/5 (40)
A 10 percent increase in gasoline prices reduces gasoline consumption by about
(Multiple Choice)
4.9/5 (31)
Suppose a market has the demand function Qd=20-0.5P. Between which of the following price ranges is demand most inelastic?
(Multiple Choice)
4.9/5 (32)
Figure 5-13 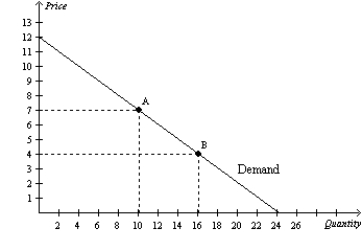 -Refer to Figure 5-13. Between point A and point B, price elasticity of demand using the midpoint method is equal to
(Multiple Choice)
4.8/5 (36)
If an increase in income results in a decrease in the quantity demanded of a good, then for that good, the
(Multiple Choice)
4.8/5 (35)
Filters
- Essay(0)
- Multiple Choice(0)
- Short Answer(0)
- True False(0)
- Matching(0)