Exam 5: Elasticity and Its Application
Exam 1: Ten Principles of Economics438 Questions
Exam 2: Thinking Like an Economist620 Questions
Exam 3: Interdependence and the Gains From Trade527 Questions
Exam 4: The Market Forces of Supply and Demand700 Questions
Exam 5: Elasticity and Its Application598 Questions
Exam 6: Supply, Demand, and Government Policies648 Questions
Exam 7: Consumers, Producers, and the Efficiency of Markets547 Questions
Exam 8: Application: the Costs of Taxation514 Questions
Exam 9: Application: International Trade496 Questions
Exam 10: Measuring a Nations Income522 Questions
Exam 11: Measuring the Cost of Living545 Questions
Exam 12: Production and Growth507 Questions
Exam 13: Saving, Investment, and the Financial System567 Questions
Exam 14: The Basic Tools of Finance513 Questions
Exam 15: Unemployment699 Questions
Exam 16: The Monetary System517 Questions
Exam 17: Money Growth and Inflation487 Questions
Exam 18: Open-Economy Macroeconomics: Basic Concepts522 Questions
Exam 19: A Macroeconomic Theory of the Open Economy484 Questions
Exam 20: Aggregate Demand and Aggregate Supply563 Questions
Exam 21: The Influence of Monetary and Fiscal Policy on Aggregate Demand511 Questions
Exam 22: The Short-Run Trade-Off Between Inflation and Unemployment516 Questions
Exam 23: Six Debates Over Macroeconomic Policy372 Questions
Select questions type
Heath's income elasticity of demand for concerts is 2. All else equal, this means that if his income increases by 10 percent, he will purchase tickets for
(Multiple Choice)
4.8/5  (30)
(30)
Table 5-8
 -Refer to Table 5-8. Using the midpoint method, what is the income elasticity of demand for good X?
(Multiple Choice)
4.8/5 (35)
Scenario 5-6
Suppose the government is concerned about firms in the United States importing illegal caviar. As a result, the government increases border patrols to catch illegal shipments. U.S. Customs agents perform DNA testing on the caviar to determine if it comes from endangered species of fish. If so, the government destroys the caviar.
-Refer to Scenario 5-6. What would we expect to observe in the caviar market?
(Multiple Choice)
5.0/5 (38)
If two goods are substitutes, their cross-price elasticity will be
(Multiple Choice)
4.9/5 (35)
In general, demand curves for necessities tend to be price elastic.
(True/False)
4.8/5 (30)
You are in charge of the local city-owned aquatic center. You need to increase the revenue generated by the aquatic center to meet expenses. The mayor advises you to increase the price of a day pass. The city manager recommends reducing the price of a day pass. You realize that
(Multiple Choice)
4.7/5 (39)
Which of the following could be the price elasticity of demand for a good for which an increase in price would increase revenue?
(Multiple Choice)
4.8/5 (37)
Figure 5-4 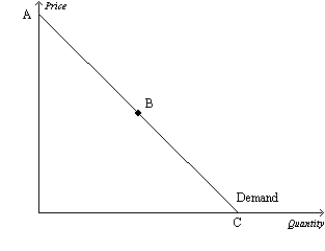 -Refer to Figure 5-4. Assume, for the good in question, two specific points on the demand curve are Q = 1,000, P= $40) and Q = 1,500, P = $30). Then which of the following scenarios is possible?
(Multiple Choice)
4.8/5 (30)
OPEC successfully raised the world price of oil in the 1970s and early 1980s, primarily due to
(Multiple Choice)
4.9/5 (34)
If a 20% increase in price for a good results in a 15% decrease in quantity demanded, the price elasticity of demand is
(Multiple Choice)
4.7/5 (40)
Use the graph shown to answer the following questions. Put the correct letters) in the blank.  a. The elastic section of the graph is represented by section _______.
b. The inelastic section of the graph is represented by section _______.
c. The unit elastic section of the graph is represented by section .
d. The portion of the graph in which a decrease in price would cause total revenue to fall would be _________.
e. The portion of the graph in which a decrease in price would cause total revenue to rise would be _________.
f. The portion of the graph in which a decrease in price would not cause a change in total revenue would be _________.
g. The section of the graph in which total revenue would be at a maximum would be
_______.
h. The section of the graph in which elasticity is greater than 1 is .
i. The section of the graph in which elasticity is equal to 1 is .
j. The section of the graph in which elasticity is less than 1 is .
a. The elastic section of the graph is represented by section _______.
b. The inelastic section of the graph is represented by section _______.
c. The unit elastic section of the graph is represented by section .
d. The portion of the graph in which a decrease in price would cause total revenue to fall would be _________.
e. The portion of the graph in which a decrease in price would cause total revenue to rise would be _________.
f. The portion of the graph in which a decrease in price would not cause a change in total revenue would be _________.
g. The section of the graph in which total revenue would be at a maximum would be
_______.
h. The section of the graph in which elasticity is greater than 1 is .
i. The section of the graph in which elasticity is equal to 1 is .
j. The section of the graph in which elasticity is less than 1 is .
(Essay)
4.9/5 (32)
There are very few, if any, good substitutes for motor oil. Therefore, the
(Multiple Choice)
5.0/5 (43)
A linear, downward-sloping demand curve has a constant elasticity but a changing slope.
(True/False)
4.7/5 (39)
Supply tends to be more elastic in the short run and more inelastic in the long run.
(True/False)
4.8/5 (31)
Figure 5-3 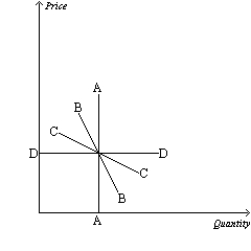 -Refer to Figure 5-3. Which demand curve is perfectly inelastic?
(Multiple Choice)
4.8/5 (31)
When the price of a good is $5, the quantity demanded is 100 units per month; when the price is $7, the quantity demanded is 80 units per month. Using the midpoint method, the price elasticity of demand is about
(Multiple Choice)
4.8/5 (25)
If the cross-price elasticity of two goods is negative, then the two goods are
(Multiple Choice)
4.9/5 (38)
Filters
- Essay(0)
- Multiple Choice(0)
- Short Answer(0)
- True False(0)
- Matching(0)