Exam 5: Elasticity and Its Application
Exam 1: Ten Principles of Economics438 Questions
Exam 2: Thinking Like an Economist620 Questions
Exam 3: Interdependence and the Gains From Trade527 Questions
Exam 4: The Market Forces of Supply and Demand700 Questions
Exam 5: Elasticity and Its Application598 Questions
Exam 6: Supply, Demand, and Government Policies648 Questions
Exam 7: Consumers, Producers, and the Efficiency of Markets547 Questions
Exam 8: Application: the Costs of Taxation514 Questions
Exam 9: Application: International Trade496 Questions
Exam 10: Measuring a Nations Income522 Questions
Exam 11: Measuring the Cost of Living545 Questions
Exam 12: Production and Growth507 Questions
Exam 13: Saving, Investment, and the Financial System567 Questions
Exam 14: The Basic Tools of Finance513 Questions
Exam 15: Unemployment699 Questions
Exam 16: The Monetary System517 Questions
Exam 17: Money Growth and Inflation487 Questions
Exam 18: Open-Economy Macroeconomics: Basic Concepts522 Questions
Exam 19: A Macroeconomic Theory of the Open Economy484 Questions
Exam 20: Aggregate Demand and Aggregate Supply563 Questions
Exam 21: The Influence of Monetary and Fiscal Policy on Aggregate Demand511 Questions
Exam 22: The Short-Run Trade-Off Between Inflation and Unemployment516 Questions
Exam 23: Six Debates Over Macroeconomic Policy372 Questions
Select questions type
Elasticity measures how responsive quantity is to changes in price.
(True/False)
5.0/5  (38)
(38)
Demand for a good is said to be inelastic if the quantity demanded increases substantially when the price falls by a small amount.
(True/False)
5.0/5 (37)
Figure 5-15 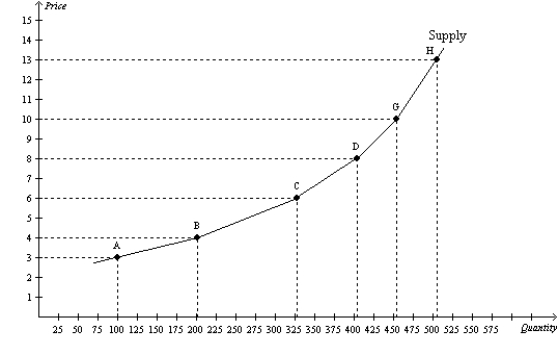 -Refer to Figure 5-15. Using the midpoint method, what is the price elasticity of supply between points D and G?
(Multiple Choice)
4.8/5 (32)
Figure 5-18 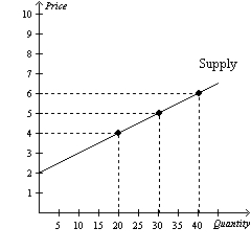 -Refer to Figure 5-18. Using the midpoint method, what is the price elasticity of supply between $5 and $6?
(Multiple Choice)
4.9/5 (33)
Which of the following is likely to have the most price elastic demand?
(Multiple Choice)
4.8/5 (34)
Table 5-13
Consider the following demand schedule.
 -Refer to Table 5-13. Using the midpoint method, between which two prices is price elasticity of demand most inelastic?
(Essay)
4.9/5 (31)
Which of the following statements does not help to explain why government drug interdiction increases drug-related crime?
(Multiple Choice)
4.8/5 (36)
If the cross-price elasticity of demand between two goods is positive, what is the relationship between the two goods?
(Essay)
4.8/5 (36)
If the price elasticity of demand is equal to 0, then demand is unit elastic.
(True/False)
4.8/5 (36)
Which of the following is likely to have the most price inelastic demand?
(Multiple Choice)
4.9/5 (45)
Figure 5-17 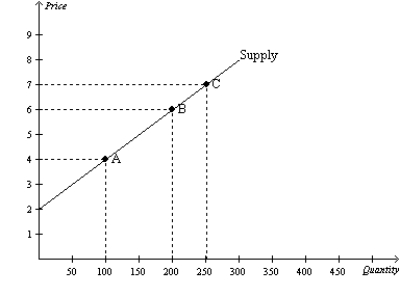 -Refer to Figure 5-17. Using the midpoint method, what is the price elasticity of supply between point A and point B?
(Multiple Choice)
4.8/5 (36)
Which of the following statements helps to explain why government drug interdiction increases drug-related crime?
(Multiple Choice)
4.8/5 (34)
Normal goods have negative income elasticities of demand, while inferior goods have positive income elasticities of demand.
(True/False)
4.7/5 (37)
Figure 5-4 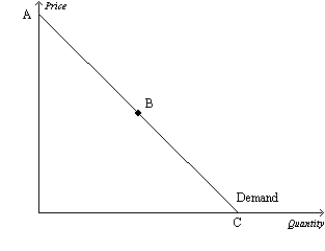 -Refer to Figure 5-4. Assume the section of the demand curve from B to C corresponds to prices between $0 and $15. Then, when the price changes between $7 and $9,
(Multiple Choice)
4.8/5 (35)
Figure 5-16 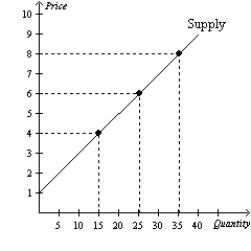 -Refer to Figure 5-16. Using the midpoint method, what is the price elasticity of supply between $6 and $8?
(Multiple Choice)
4.8/5 (30)
If the price elasticity of supply is 1.5, and a price increase led to a 3% increase in quantity supplied, then the price increase is about
(Multiple Choice)
4.8/5 (36)
When quantity demanded responds strongly to changes in price, demand is said to be
(Multiple Choice)
4.8/5 (37)
Scenario 5-7
Suppose the demand function for good X is given by: 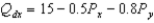 where
where  is the quantity demanded of good X,
  is the price of good X, and
  is the price of good Y, which is related to good X.
-Refer to Scenario 5-7. Using the midpoint method, if the price of good X is $10 and the price of good Y increases from $8 to $10, the cross price elasticity of demand is about
is the price of good Y, which is related to good X.
-Refer to Scenario 5-7. Using the midpoint method, if the price of good X is $10 and the price of good Y increases from $8 to $10, the cross price elasticity of demand is about
(Essay)
4.9/5 (45)
Refer to Figure 5-5. Using the midpoint method, between prices of $50 and $60, price elasticity of demand is about
(Multiple Choice)
4.9/5 (35)
Filters
- Essay(0)
- Multiple Choice(0)
- Short Answer(0)
- True False(0)
- Matching(0)