Exam 5: Elasticity and Its Application
Exam 1: Ten Principles of Economics438 Questions
Exam 2: Thinking Like an Economist620 Questions
Exam 3: Interdependence and the Gains From Trade527 Questions
Exam 4: The Market Forces of Supply and Demand700 Questions
Exam 5: Elasticity and Its Application598 Questions
Exam 6: Supply, Demand, and Government Policies648 Questions
Exam 7: Consumers, Producers, and the Efficiency of Markets547 Questions
Exam 8: Application: the Costs of Taxation514 Questions
Exam 9: Application: International Trade496 Questions
Exam 10: Measuring a Nations Income522 Questions
Exam 11: Measuring the Cost of Living545 Questions
Exam 12: Production and Growth507 Questions
Exam 13: Saving, Investment, and the Financial System567 Questions
Exam 14: The Basic Tools of Finance513 Questions
Exam 15: Unemployment699 Questions
Exam 16: The Monetary System517 Questions
Exam 17: Money Growth and Inflation487 Questions
Exam 18: Open-Economy Macroeconomics: Basic Concepts522 Questions
Exam 19: A Macroeconomic Theory of the Open Economy484 Questions
Exam 20: Aggregate Demand and Aggregate Supply563 Questions
Exam 21: The Influence of Monetary and Fiscal Policy on Aggregate Demand511 Questions
Exam 22: The Short-Run Trade-Off Between Inflation and Unemployment516 Questions
Exam 23: Six Debates Over Macroeconomic Policy372 Questions
Select questions type
An increase in price causes an increase in total revenue when demand is
(Multiple Choice)
4.9/5  (30)
(30)
Figure 5-2 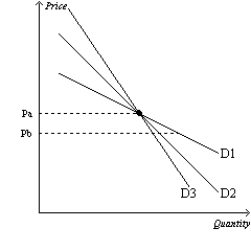 -Refer to Figure 5-2. As price falls from Pa to Pb, we could use the three demand curves to calculate three different values of the price elasticity of demand. Which of the three demand curves would produce the smallest elasticity?
(Multiple Choice)
4.8/5 (33)
Figure 5-4 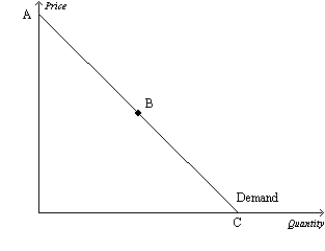 -Refer to Figure 5-4. If the price increases in the region of the demand curve between points B and C, we can expect total revenue to
(Multiple Choice)
4.8/5 (32)
If the income elasticity of demand for a good is negative, then the good must be an inferior good.
(True/False)
4.8/5 (35)
Assume that a 4 percent increase in income results in a 2 percent increase in the quantity demanded of a good. The income elasticity of demand for the good is
(Multiple Choice)
4.8/5 (37)
Which of the following should be held constant when calculating an income elasticity of demand?
(Multiple Choice)
4.8/5 (30)
Figure 5-20 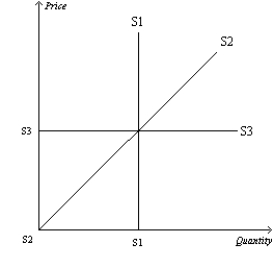 -Refer to Figure 5-20. Which supply curve represents perfectly inelastic supply?
(Multiple Choice)
4.8/5 (40)
The federal government is concerned about the negative effects of cigarette smoking in the United States. Suppose Congress is considering two plans. One plan would limit the production of cigarettes. The other would require manufacturers to include graphic photos on cigarette packages of people suffering cancer's effects. Which of the following statements is true?
(Multiple Choice)
4.9/5 (33)
Suppose that good X has few close substitutes and that good Y has many close substitutes. Which good would you expect to have more price elastic demand?
(Essay)
4.9/5 (41)
Holding all other forces constant, if increasing the price of a good leads to a decrease in total revenue, then the demand for the good must be
(Multiple Choice)
4.9/5 (36)
Maddy purchases 2 pounds of beans and 3 pounds of rice per month when the price of beans is $2 per pound. She purchases 1 pounds of beans and 4 pounds of rice per month when the price of beans is $3 per pound. Maddy's cross-price elasticity of demand for beans and rice is
(Multiple Choice)
4.7/5 (45)
Suppose the price of a bag of frozen chicken nuggets decreases from $6.50 to $5.75 and, as a result, the quantity of bags demanded increases from 600 to 800. Using the midpoint method, the price elasticity of demand for frozen chicken nuggets in the given price range is
(Multiple Choice)
4.8/5 (39)
Table 5-11
 -Refer to Table 5-11. Which scenario describes the market for oil in the short run?
(Multiple Choice)
4.8/5 (32)
When the price of an eBook is $15.00, the quantity demanded is 400 eBooks per day. When the price falls to $10.00, the quantity demanded increases to 700. Given this information and using the midpoint method, we know that the demand for eBooks is
(Multiple Choice)
4.9/5 (39)
To determine whether a good is considered normal or inferior, one could examine the value of the
(Multiple Choice)
4.9/5 (37)
Suppose the price of a bag of tortilla chips decreases from $3.00 to $2.50 and, as a result, the quantity of tortilla chips demanded increases from 200 bags to 300 bags. Using the midpoint method, the price elasticity of demand for tortilla chips in the given price range is
(Multiple Choice)
4.9/5 (44)
Filters
- Essay(0)
- Multiple Choice(0)
- Short Answer(0)
- True False(0)
- Matching(0)