Exam 10: Regression Analysis: Estimating Relationships
Exam 1: Introduction to Data Analysis and Decision Making30 Questions
Exam 2: Describing the Distribution of a Single Variable97 Questions
Exam 3: Finding Relationships Among Variables84 Questions
Exam 4: Probability and Probability Distributions113 Questions
Exam 5: Normal, binomial, poisson, and Exponential Distributions118 Questions
Exam 6: Decision Making Under Uncertainty106 Questions
Exam 7: Sampling and Sampling Distributions92 Questions
Exam 8: Confidence Interval Estimation85 Questions
Exam 9: Hypothesis Testing85 Questions
Exam 10: Regression Analysis: Estimating Relationships97 Questions
Exam 11: Regression Analysis: Statistical Inference87 Questions
Exam 12: Time Series Analysis and Forecasting104 Questions
Exam 13: Introduction to Optimization Modeling91 Questions
Exam 14: Optimization Modeling: Applications115 Questions
Exam 15: Introduction to Simulation Modeling81 Questions
Exam 16: Simulation Models104 Questions
Select questions type
A logarithmic transformation of the response variable Y is often useful when the distribution of Y is symmetric.
(True/False)
4.7/5  (36)
(36)
Use what you have learned about transformations to fit an alternative model to the one in Question 135.
(Essay)
4.8/5 (36)
A single variable X can explain a large percentage of the variation in some other variable Y when the two variables are:
(Multiple Choice)
4.8/5 (26)
The effect of a logarithmic transformation on a variable that is skewed to the right by a few large values is to "squeeze" the values together and make the distribution more symmetric
(True/False)
5.0/5 (33)
In linear regression,we can have an interaction variable.Algebraically,the interaction variable is the other variables in the regression equation.
(Multiple Choice)
4.8/5 (35)
(A)Use the information above to estimate the linear regression model.
(B)Interpret each of the estimated regression coefficients of the regression model in (A).
(C)Would any of the variables in this model be considered a dummy variable? Explain your answer.
(D)Identify and interpret the coefficient of determination (  )and the standard error of the estimate (se)for the model in (A).
(Essay)
4.9/5 (48)
In a nonlinear transformation of data,the Y variable or the X variables may be transformed,but not both.
(True/False)
4.7/5 (38)
The residual is defined as the difference between the actual and predicted,or fitted values of the response variable.
(True/False)
4.8/5 (38)
In regression analysis,which of the following causal relationships are possible?
(Multiple Choice)
4.9/5 (36)
A regression analysis between sales (in $1000)and advertising (in $)resulted in the following least squares line:  = 32 + 8X.This implies that an increase of $1 in advertising is expected to result in an increase of $40 in sales.
(True/False)
4.8/5 (33)
For the multiple regression model 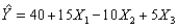 ,if
,if  were to increase by 5 units,holding
  and
and  constant,the value of Y would be expected to decrease by 50 units.
(True/False)
5.0/5 (39)
Scatterplots are used for identifying outliers and quantifying relationships between variables.
(True/False)
4.8/5 (27)
The multiple R for a regression is the correlation between the observed Y values and the fitted Y values.
.
(True/False)
4.9/5 (38)
In reference to the equation, 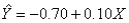 ,the value 0.10 is the expected change in Y per unit change in
  .
.
(True/False)
4.8/5 (40)
Filters
- Essay(0)
- Multiple Choice(0)
- Short Answer(0)
- True False(0)
- Matching(0)