Exam 10: Regression Analysis: Estimating Relationships
Exam 1: Introduction to Data Analysis and Decision Making30 Questions
Exam 2: Describing the Distribution of a Single Variable97 Questions
Exam 3: Finding Relationships Among Variables84 Questions
Exam 4: Probability and Probability Distributions113 Questions
Exam 5: Normal, binomial, poisson, and Exponential Distributions118 Questions
Exam 6: Decision Making Under Uncertainty106 Questions
Exam 7: Sampling and Sampling Distributions92 Questions
Exam 8: Confidence Interval Estimation85 Questions
Exam 9: Hypothesis Testing85 Questions
Exam 10: Regression Analysis: Estimating Relationships97 Questions
Exam 11: Regression Analysis: Statistical Inference87 Questions
Exam 12: Time Series Analysis and Forecasting104 Questions
Exam 13: Introduction to Optimization Modeling91 Questions
Exam 14: Optimization Modeling: Applications115 Questions
Exam 15: Introduction to Simulation Modeling81 Questions
Exam 16: Simulation Models104 Questions
Select questions type
In a simple linear regression problem,suppose that  = 12.48 and
  = 124.8.Then the percentage of variation explained
  must be 0.90.
(True/False)
4.7/5  (44)
(44)
The regression line 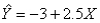 has been fitted to the data points (28,60),(20,50),(10,18),and (25,55).The sum of the squared residuals will be:
(Multiple Choice)
4.8/5 (28)
A useful graph in almost any regression analysis is a scatterplot of residuals (on the vertical axis)versus fitted values (on the horizontal axis),where a "good" fit not only has small residuals,but it has residuals scattered randomly around zero with no apparent pattern.
(True/False)
4.8/5 (41)
A constant elasticity,or multiplicative,model the dependent variable is expressed as a product of explanatory variables raised to powers
(True/False)
4.8/5 (26)
In every regression study there is a single variable that we are trying to explain or predict.This is called the response variable or dependent variable.
(True/False)
4.8/5 (38)
In a multiple regression problem with two explanatory variables if,the fitted regression equation is 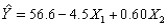 ,then the estimated value of Y when
  and
and  is 49.4.
(True/False)
4.7/5 (39)
The percentage of variation (  )can be interpreted as the fraction (or percent)of variation of the
(Multiple Choice)
4.7/5 (29)
In the multiple regression model 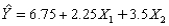 we interpret X1 as follows: holding X2 constant,if X1 increases by 1 unit,then the expected value of Y will increase by 9 units.
(True/False)
5.0/5 (34)
Regression analysis can be applied equally well to cross-sectional and time series data.
(True/False)
4.9/5 (46)
The adjusted R2 is used primarily to monitor whether extra explanatory variables really belong in a multiple regression model
(True/False)
4.7/5 (30)
In regression analysis,we can often use the standard error of estimate  to judge which of several potential regression equations is the most useful.
(True/False)
4.7/5 (34)
Approximately what percentage of the observed Y values are within on standard error of the estimate (  )of the corresponding fitted Y values?
(Multiple Choice)
4.8/5 (36)
A scatterplot that appears as a shapeless mass of data points indicates:
(Multiple Choice)
4.8/5 (44)
If a categorical variable is to be included in a multiple regression,a dummy variable for each category of the variable should be used,but the original categorical variables should not be sued.
(True/False)
5.0/5 (43)
Filters
- Essay(0)
- Multiple Choice(0)
- Short Answer(0)
- True False(0)
- Matching(0)