Exam 3: Frequency Distributions and Percentiles
Exam 1: Introduction to Statistics43 Questions
Exam 2: Statistics and the Research Process75 Questions
Exam 3: Frequency Distributions and Percentiles48 Questions
Exam 4: Measures of Central Tendency;the Mean, median, and Mode62 Questions
Exam 5: Measures of Variability: Range, variance, and Standard Deviation59 Questions
Exam 6: Z-Scores and the Normal Curve60 Questions
Exam 7: The Correlation Coefficient52 Questions
Exam 8: Linear Regression52 Questions
Exam 9: Using Probability to Make Decisions About Data56 Questions
Exam 10: Introduction to Hypothesis Testing56 Questions
Exam 11: Performing the One-Sample T-Test and Testing Correlation Coefficients57 Questions
Exam 12: The Two-Sample T-Test65 Questions
Exam 13: The One-Way Analysis of Variance61 Questions
Exam 14: The Two-Way Analysis of Variance56 Questions
Exam 15: Chi Square and Other Nonparametric Procedures49 Questions
Select questions type
The percentile is defined as the _____ of all scores in the data that are at or _____ a certain score.
(Multiple Choice)
4.7/5  (40)
(40)
In a normal distribution,if 5% of the scores are greater than 80,what percentage of the scores are between the mean and 80?
(Multiple Choice)
4.9/5 (40)
On a national qualifying exam,one student had a raw score of 85,and another student had percentile of 85.Which is better,a raw score of 85 or a percentile of 85?
(Multiple Choice)
4.8/5 (31)
In a simple frequency distribution constructed from the data 9,8,8,7,7,7,5,5,4,4,4,4,3,2,2,1,0,0,the score "7" would have an f of
(Multiple Choice)
4.8/5 (38)
An advantage of percentiles over cumulative frequencies is that
(Multiple Choice)
4.8/5 (49)
When graphing the frequencies of males and females in the class,a _____ graph should be used.
(Multiple Choice)
4.7/5 (36)
If the number of hot lunches sold at school this week was 1,350 and the relative frequency on Friday was 0.22,how many lunches were sold on Friday?
(Multiple Choice)
4.8/5 (33)
In the following frequency distribution table,what is the error? 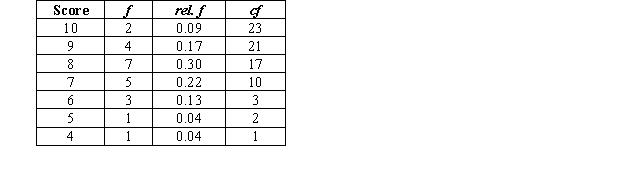
(Multiple Choice)
4.8/5 (27)
In a normal distribution,the low-frequency,extreme scores located on the far left and far right of the distribution are called the
(Multiple Choice)
4.9/5 (34)
In a normal distribution with a mean of 30 what percentage of the scores would be above the mean?
(Multiple Choice)
4.8/5 (40)
When graphing the frequencies of response times from an experiment,a _____ graph should be used.
(Multiple Choice)
4.9/5 (39)
In a normal distribution,if 35% of the scores are between the score of 40 and the mean,what percentage of the scores are below 40?
(Multiple Choice)
4.8/5 (30)
For the following data what values should be in the Score column of the frequency distribution table? 8,8 8,7,5,5,5,5,4,4,3,3,3,2,1,1,1,1,1
(Multiple Choice)
4.9/5 (31)
The distinguishing characteristic of the frequency polygon is that
(Multiple Choice)
4.9/5 (38)
What is the relative frequency for the score of 12 in the following simple frequency distribution? 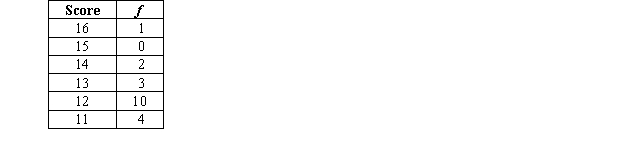
(Multiple Choice)
4.9/5 (29)
In a normal curve,the proportion of the area under the curve between two scores represents
(Multiple Choice)
4.8/5 (37)
Filters
- Essay(0)
- Multiple Choice(0)
- Short Answer(0)
- True False(0)
- Matching(0)