Exam 3: Frequency Distributions and Percentiles
Exam 1: Introduction to Statistics43 Questions
Exam 2: Statistics and the Research Process75 Questions
Exam 3: Frequency Distributions and Percentiles48 Questions
Exam 4: Measures of Central Tendency;the Mean, median, and Mode62 Questions
Exam 5: Measures of Variability: Range, variance, and Standard Deviation59 Questions
Exam 6: Z-Scores and the Normal Curve60 Questions
Exam 7: The Correlation Coefficient52 Questions
Exam 8: Linear Regression52 Questions
Exam 9: Using Probability to Make Decisions About Data56 Questions
Exam 10: Introduction to Hypothesis Testing56 Questions
Exam 11: Performing the One-Sample T-Test and Testing Correlation Coefficients57 Questions
Exam 12: The Two-Sample T-Test65 Questions
Exam 13: The One-Way Analysis of Variance61 Questions
Exam 14: The Two-Way Analysis of Variance56 Questions
Exam 15: Chi Square and Other Nonparametric Procedures49 Questions
Select questions type
One benefit to using a frequency distribution table or graph is that it makes it easier to
(Multiple Choice)
4.8/5  (28)
(28)
What is the most frequently occurring score in the following frequency distribution? 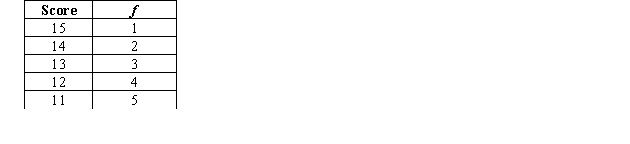
(Multiple Choice)
4.9/5 (28)
In a cumulative frequency distribution created from the following simple frequency distribution,the score "5" would have a cumulative frequency of 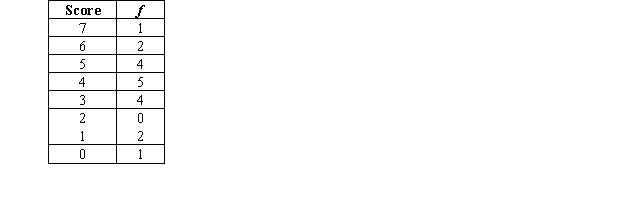
(Multiple Choice)
4.7/5 (41)
The _____ of a polygon above any score corresponds to that score's _____.
(Multiple Choice)
4.8/5 (37)
Using the frequency distribution below,what is the total frequency of the scores 6 and 7? 
(Multiple Choice)
4.9/5 (46)
A graph of a frequency distribution shows the scores on the
(Multiple Choice)
4.9/5 (37)
The proportion of area under the normal curve that is directly above a score is the _____ of the score.The percentage of the normal curve to the left of a score is the _____ of the score.
(Multiple Choice)
4.8/5 (38)
Filters
- Essay(0)
- Multiple Choice(0)
- Short Answer(0)
- True False(0)
- Matching(0)