Exam 4: Descriptive Statistics
Exam 1: Overview of Statistics54 Questions
Exam 2: Data Collection113 Questions
Exam 3: Describing Data Visually108 Questions
Exam 4: Descriptive Statistics156 Questions
Exam 5: Probability114 Questions
Exam 6: Discrete Probability Distributions111 Questions
Exam 7: Continuous Probability Distributions114 Questions
Exam 8: Sampling Distributions and Estimation107 Questions
Exam 9: One-Sample Hypothesis Tests135 Questions
Exam 10: Two-Sample Hypothesis Tests116 Questions
Exam 11: Analysis of Variance95 Questions
Exam 12: Simple Regression141 Questions
Exam 13: Multiple Regression133 Questions
Exam 14: Chi-Square Tests95 Questions
Select questions type
Six graduates from Fulsome University's Master's of Waste Management program were hired by a Saudi Arabian firm at $110,000 each,while the other four graduates were unemployed.The university placement office bragged,"Our MWM graduates enjoyed a median starting salary of $110,000." Is this a reasonable assessment of central tendency? What are the alternatives?
(Essay)
4.9/5  (33)
(33)
Which is the Excel formula for the standard deviation of a sample array named Data?
(Multiple Choice)
4.8/5 (37)
The 25th percentile for waiting time in a doctor's office is 19 minutes.The 75th percentile is 31 minutes.The interquartile range (IQR)is
(Multiple Choice)
4.9/5 (48)
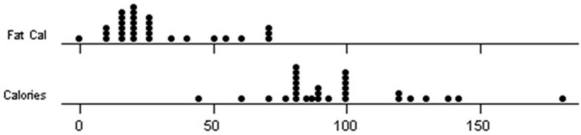
A team of introductory statistics students went to a grocery store and recorded the total calories and fat calories for various kinds of soup.They produced a table of statistics and two dot plots.Write a succinct summary of the center,variability,and shape for each data set.Note: TrimMean is the 5 percent trimmed mean (removing the smallest 5 percent and the largest 5 percent of the values,rounded to the nearest integer).

(Essay)
4.7/5 (36)
A survey of 10 randomly chosen drivers showed the following number of persons per car,including the driver: 1,5,1,5,2,1,1,1,2,1.Describe the center,variability,and skewness for this sample. 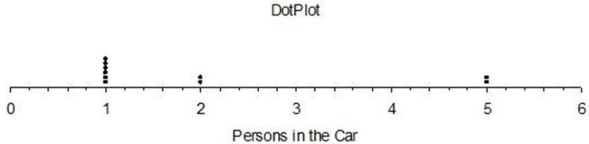
(Essay)
4.8/5 (35)
Twelve students were asked how many credit cards they owned.The responses were 0,0,1,2,2,3,3,4,4,5,5,11.(A)Find the mean,median,and mode.(B)Which measure of center seems best in this case? (C)Find the first and third quartiles.What do they tell you?
(Essay)
4.9/5 (42)
John scored 35 on Prof.Johnson's exam (Q1 = 70 and Q3 = 80).Based on the fences,which is correct?
(Multiple Choice)
4.8/5 (37)
Eleven students were asked how many siblings they had.The responses were 0,1,2,2,2,2,2,3,3,4,5.Find the mean,median,mode,and geometric mean.Which would you prefer in this case,and why not the others?
(Essay)
4.8/5 (28)
A trimmed mean may be preferable to a mean when a data set has extreme values.
(True/False)
5.0/5 (34)
It is inappropriate to apply the Empirical Rule to a population that is right-skewed.
(True/False)
4.8/5 (45)
In a sample of 10,000 observations from a normal population,how many would you expect to lie beyond three standard deviations of the mean?
(Multiple Choice)
4.9/5 (40)
What does the graph below (profit/sales ratios for 25 Fortune 500 companies)reveal? 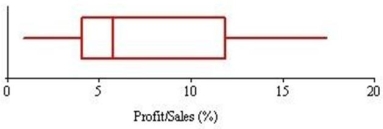
(Multiple Choice)
4.9/5 (41)
Three randomly chosen Colorado students were asked how many times they went rock climbing last month.Their replies were 5,6,7.The standard deviation is
(Multiple Choice)
4.8/5 (44)
If the standard deviations of two samples are the same,so are their coefficients of variation.
(True/False)
5.0/5 (44)
Filters
- Essay(0)
- Multiple Choice(0)
- Short Answer(0)
- True False(0)
- Matching(0)