Exam 8: Application: the Costs of Taxation
Exam 1: Ten Principles of Economics439 Questions
Exam 2: Thinking Like an Economist617 Questions
Exam 3: Interdependence and the Gains From Trade527 Questions
Exam 4: The Market Forces of Supply and Demand697 Questions
Exam 5: Elasticity and Its Application594 Questions
Exam 6: Supply, Demand, and Government Policies645 Questions
Exam 7: Consumers, Producers, and the Efficiency of Markets549 Questions
Exam 8: Application: the Costs of Taxation513 Questions
Exam 9: Application: International Trade492 Questions
Exam 10: Externalities524 Questions
Exam 11: Public Goods and Common Resources433 Questions
Exam 12: The Design of the Tax System549 Questions
Exam 13: The Costs of Production420 Questions
Exam 14: Firms in Competitive Markets543 Questions
Exam 15: Monopoly637 Questions
Exam 16: Monopolistic Competition580 Questions
Exam 17: Oligopoly488 Questions
Exam 18: The Markets for the Factors of Production564 Questions
Exam 19: Earnings and Discrimination490 Questions
Exam 20: Income Inequality and Poverty455 Questions
Exam 21: The Theory of Consumer Choice431 Questions
Exam 22: Frontiers of Microeconomics440 Questions
Exam 23: Measuring a Nations Income520 Questions
Exam 24: Measuring the Cost of Living529 Questions
Exam 25: Production and Growth505 Questions
Exam 26: Saving, Investment, and the Financial System564 Questions
Exam 27: The Basic Tools of Finance500 Questions
Exam 28: Unemployment678 Questions
Exam 29: The Monetary System515 Questions
Exam 30: Money Growth and Inflation481 Questions
Exam 31: Open-Economy Macroeconomics: Basic Concepts522 Questions
Exam 32: A Macroeconomic Theory of the Open Economy475 Questions
Exam 33: Aggregate Demand and Aggregate Supply562 Questions
Exam 34: The Influence of Monetary and Fiscal Policy on Aggregate Demand508 Questions
Exam 35: The Short-Run Trade-Off Between Inflation and Unemployment491 Questions
Exam 36: Six Debates Over Macroeconomic Policy372 Questions
Select questions type
Economist Arthur Laffer made the argument that tax rates in the United States were so high that reducing the rates would increase tax revenue.
(True/False)
4.8/5  (31)
(31)
Figure 8-14 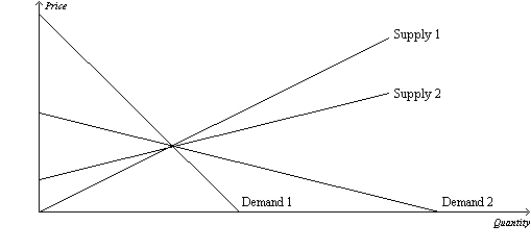 -Refer to Figure 8-14. Which of the following combinations will minimize the deadweight loss from a tax?
(Multiple Choice)
4.8/5 (39)
Suppose that the market for product X is characterized by a typical, downward-sloping, linear demand curve and a typical, upward-sloping, linear supply curve. Suppose the price elasticity of supply is 0.7. Will the deadweight loss from a $3 tax per unit be smaller if the absolute value of the price elasticity of demand is 0.6 or if the absolute value of the price elasticity of demand is 1.5?
(Essay)
4.9/5 (36)
The supply curve for whiskey is the typical upward-sloping straight line, and the demand curve for whiskey is the typical downward-sloping straight line. When whiskey is taxed, the area on the relevant supply-and-demand graph that represents
(Multiple Choice)
4.8/5 (30)
If the government imposes a $3 tax in a market, the buyers and sellers will share an equal burden of the tax.
(True/False)
4.8/5 (43)
Tom walks Bethany's dog once a day for $50 per week. Bethany values this service at $60 per week, while the opportunity cost of Tom's time is $30 per week. The government places a tax of $35 per week on dog walkers. After the tax, what is the loss in total surplus?
(Multiple Choice)
4.9/5 (40)
Figure 8-15  -Refer to Figure 8-15. Panel (a) and Panel (b) each illustrate a $4 tax placed on a market. In comparison to Panel (a), Panel (b) illustrates which of the following statements?
(Multiple Choice)
4.9/5 (41)
Figure 8-5
Suppose that the government imposes a tax of P3 - P1.  -Refer to Figure 8-5. After the tax is levied, consumer surplus is represented by area
(Multiple Choice)
4.7/5 (34)
If a tax shifts the supply curve downward (or to the right), we can infer that the tax was levied on
(Multiple Choice)
4.8/5 (42)
A $2 tax per gallon of paint placed on the buyers of paint will shift the demand curve
(Multiple Choice)
4.8/5 (40)
Suppose the government increases the size of a tax by 20 percent. The deadweight loss from that tax
(Multiple Choice)
4.7/5 (36)
Scenario 8-1
Erin would be willing to pay as much as $100 per week to have her house cleaned. Ernesto's opportunity cost of cleaning Erin's house is $70 per week.
-Refer to Scenario 8-1. Assume Erin is required to pay a tax of $5 when she hires someone to clean her house. Which of the following is true?
(Multiple Choice)
4.9/5 (36)
Suppose a tax of $5 per unit is imposed on a good, and the tax causes the equilibrium quantity of the good to decrease from 200 units to 100 units. The tax decreases consumer surplus by $450 and decreases producer surplus by $300. The deadweight loss from the tax is
(Multiple Choice)
4.8/5 (40)
The larger the deadweight loss from taxation, the larger the cost of government programs.
(True/False)
4.8/5 (37)
Figure 8-8
Suppose the government imposes a $10 per unit tax on a good. 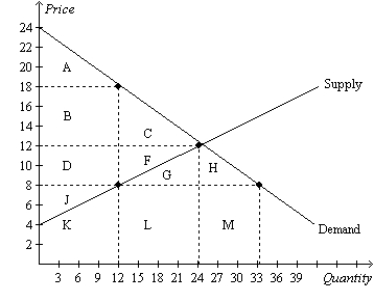 -Refer to Figure 8-8. The tax causes producer surplus to decrease by the area
(Multiple Choice)
4.8/5 (38)
The less freedom people are given to choose the date of their retirement, the
(Multiple Choice)
4.8/5 (40)
Figure 8-11  -Refer to Figure 8-11. Neither a shift of the demand curve nor a shift of the supply curve is shown on the figure. However, we know that, when the tax is imposed,
(Multiple Choice)
4.9/5 (38)
Suppose the government imposes a tax on cheese. The deadweight loss from this tax will likely be greater in the
(Multiple Choice)
4.8/5 (29)
Filters
- Essay(0)
- Multiple Choice(0)
- Short Answer(0)
- True False(0)
- Matching(0)