Exam 8: Application: the Costs of Taxation
Exam 1: Ten Principles of Economics439 Questions
Exam 2: Thinking Like an Economist617 Questions
Exam 3: Interdependence and the Gains From Trade527 Questions
Exam 4: The Market Forces of Supply and Demand697 Questions
Exam 5: Elasticity and Its Application594 Questions
Exam 6: Supply, Demand, and Government Policies645 Questions
Exam 7: Consumers, Producers, and the Efficiency of Markets549 Questions
Exam 8: Application: the Costs of Taxation513 Questions
Exam 9: Application: International Trade492 Questions
Exam 10: Externalities524 Questions
Exam 11: Public Goods and Common Resources433 Questions
Exam 12: The Design of the Tax System549 Questions
Exam 13: The Costs of Production420 Questions
Exam 14: Firms in Competitive Markets543 Questions
Exam 15: Monopoly637 Questions
Exam 16: Monopolistic Competition580 Questions
Exam 17: Oligopoly488 Questions
Exam 18: The Markets for the Factors of Production564 Questions
Exam 19: Earnings and Discrimination490 Questions
Exam 20: Income Inequality and Poverty455 Questions
Exam 21: The Theory of Consumer Choice431 Questions
Exam 22: Frontiers of Microeconomics440 Questions
Exam 23: Measuring a Nations Income520 Questions
Exam 24: Measuring the Cost of Living529 Questions
Exam 25: Production and Growth505 Questions
Exam 26: Saving, Investment, and the Financial System564 Questions
Exam 27: The Basic Tools of Finance500 Questions
Exam 28: Unemployment678 Questions
Exam 29: The Monetary System515 Questions
Exam 30: Money Growth and Inflation481 Questions
Exam 31: Open-Economy Macroeconomics: Basic Concepts522 Questions
Exam 32: A Macroeconomic Theory of the Open Economy475 Questions
Exam 33: Aggregate Demand and Aggregate Supply562 Questions
Exam 34: The Influence of Monetary and Fiscal Policy on Aggregate Demand508 Questions
Exam 35: The Short-Run Trade-Off Between Inflation and Unemployment491 Questions
Exam 36: Six Debates Over Macroeconomic Policy372 Questions
Select questions type
Figure 8-9
The vertical distance between points A and C represents a tax in the market. 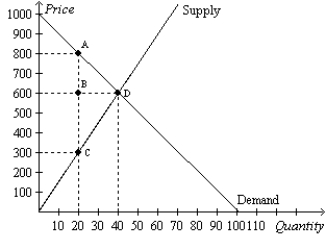 -Refer to Figure 8-9. The consumer surplus with the tax is
(Multiple Choice)
4.8/5  (39)
(39)
Figure 8-21 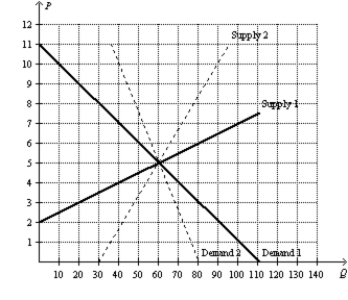 -Refer to Figure 8-21. Suppose the government places a $3 per-unit tax on this good. The smallest deadweight loss from the tax would occur in a market where demand is represented by
(Multiple Choice)
4.8/5 (29)
Which of the following tools help us evaluate how taxes affect economic well-being?
(Multiple Choice)
4.7/5 (41)
Figure 8-26 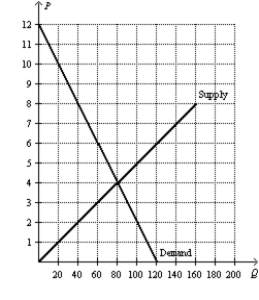 -Refer to Figure 8-26. Suppose the government places a $3 tax per unit on this good. How much tax revenue is collected after the tax is imposed?
(Essay)
4.9/5 (38)
In terms of gains from trade, why is it true that taxes cause deadweight losses?
(Essay)
4.8/5 (41)
Table 8-1  -Refer to Table 8-1. Suppose the government is considering levying a tax in one or more of the markets described in the table. Which of the markets will maximize the deadweight loss(es) from the tax?
(Multiple Choice)
4.8/5 (37)
Figure 8-13 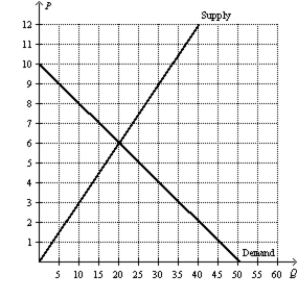 -Refer to Figure 8-13. Suppose the government places a $5 per-unit tax on this good. The producer surplus after this tax is
(Multiple Choice)
4.8/5 (38)
Figure 8-26
-Refer to Figure 8-26. Suppose the government places a $3 tax per unit on this good. What price will sellers receive for the good after the tax is imposed?
(Essay)
4.8/5 (44)
If T represents the size of the tax on a good and Q represents the quantity of the good that is sold, total tax revenue received by government can be expressed as
(Multiple Choice)
4.8/5 (40)
An increase in the size of a tax is most likely to increase tax revenue in a market with
(Multiple Choice)
4.7/5 (34)
Figure 8-6
The vertical distance between points A and B represents a tax in the market.  -Refer to Figure 8-6. When the government imposes the tax in this market, tax revenue is
(Multiple Choice)
4.9/5 (42)
Economists disagree on whether labor taxes cause small or large deadweight losses. This disagreement arises primarily because economists hold different views about
(Multiple Choice)
5.0/5 (42)
Figure 8-27 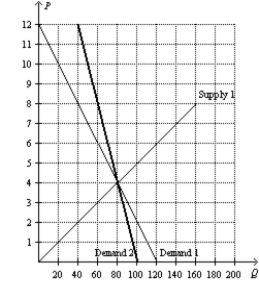 -Refer to Figure 8-27. Suppose that Market A is characterized by Demand 1 and Supply 1, and Market B is characterized by Demand 2 and Supply 1. If an identical tax is imposed on each market, the tax will create a larger deadweight loss in which market? Explain.
(Essay)
4.7/5 (29)
Figure 8-3
The vertical distance between points A and C represents a tax in the market.  -Refer to Figure 8-3. The amount of tax revenue received by the government is equal to the area
(Multiple Choice)
5.0/5 (32)
According to Arthur Laffer, the graph that represents the amount of tax revenue (measured on the vertical axis) as a function of the size of the tax (measured on the horizontal axis) looks like
(Multiple Choice)
5.0/5 (36)
Figure 8-25  -Refer to Figure 8-25. Suppose the government increases the size of the tax on this good from $4 per unit to $6 per unit. Will the tax revenue collected from the tax increase, decrease, or stay the same?
(Essay)
4.8/5 (39)
To fully understand how taxes affect economic well-being, we must compare the
(Multiple Choice)
4.9/5 (42)
Filters
- Essay(0)
- Multiple Choice(0)
- Short Answer(0)
- True False(0)
- Matching(0)