Exam 34: The Influence of Monetary and Fiscal Policy on Aggregate Demand
Exam 1: Ten Principles of Economics439 Questions
Exam 2: Thinking Like an Economist617 Questions
Exam 3: Interdependence and the Gains From Trade527 Questions
Exam 4: The Market Forces of Supply and Demand697 Questions
Exam 5: Elasticity and Its Application594 Questions
Exam 6: Supply, Demand, and Government Policies645 Questions
Exam 7: Consumers, Producers, and the Efficiency of Markets549 Questions
Exam 8: Application: the Costs of Taxation513 Questions
Exam 9: Application: International Trade492 Questions
Exam 10: Externalities524 Questions
Exam 11: Public Goods and Common Resources433 Questions
Exam 12: The Design of the Tax System549 Questions
Exam 13: The Costs of Production420 Questions
Exam 14: Firms in Competitive Markets543 Questions
Exam 15: Monopoly637 Questions
Exam 16: Monopolistic Competition580 Questions
Exam 17: Oligopoly488 Questions
Exam 18: The Markets for the Factors of Production564 Questions
Exam 19: Earnings and Discrimination490 Questions
Exam 20: Income Inequality and Poverty455 Questions
Exam 21: The Theory of Consumer Choice431 Questions
Exam 22: Frontiers of Microeconomics440 Questions
Exam 23: Measuring a Nations Income520 Questions
Exam 24: Measuring the Cost of Living529 Questions
Exam 25: Production and Growth505 Questions
Exam 26: Saving, Investment, and the Financial System564 Questions
Exam 27: The Basic Tools of Finance500 Questions
Exam 28: Unemployment678 Questions
Exam 29: The Monetary System515 Questions
Exam 30: Money Growth and Inflation481 Questions
Exam 31: Open-Economy Macroeconomics: Basic Concepts522 Questions
Exam 32: A Macroeconomic Theory of the Open Economy475 Questions
Exam 33: Aggregate Demand and Aggregate Supply562 Questions
Exam 34: The Influence of Monetary and Fiscal Policy on Aggregate Demand508 Questions
Exam 35: The Short-Run Trade-Off Between Inflation and Unemployment491 Questions
Exam 36: Six Debates Over Macroeconomic Policy372 Questions
Select questions type
An open-market purchase by the Federal Reserve creates an excess _____ of money. This causes interest rates to _____ and investment to _____. The change in investment causes aggregate demand to shift to the _____.
(Short Answer)
4.8/5  (36)
(36)
An increase in the money supply decreases the equilibrium interest rate and shifts the aggregate-demand curve to the right.
(True/False)
4.8/5 (48)
In principle, the government could increase the money supply or increase government expenditures to try to offset the effects of a wave of pessimism about the future of the economy.
(True/False)
4.8/5 (40)
A severe problem that many economists have with the active use of monetary policy and fiscal policy to stabilize the economy is that, while those policies obviously work well in practice, they are not well understood on a theoretical level.
(True/False)
4.8/5 (38)
A policy that results in slow and steady growth of the money supply is an example of
(Multiple Choice)
4.9/5 (40)
Suppose households attempt to increase their money holdings. To stabilize output by countering this increase in money demand, the Federal Reserve would
(Multiple Choice)
4.8/5 (33)
Government expenditures on capital goods such as roads could increase aggregate supply. Such effects on aggregate supply are likely to matter more in the short run than in the long run.
(True/False)
4.9/5 (44)
The main criticism of those who doubt the ability of the government to respond in a useful way to the business cycle is that the theory by which money and government expenditures change output is flawed.
(True/False)
4.9/5 (39)
Figure 34-2. On the left-hand graph, MS represents the supply of money and MD represents the demand for money; on the right-hand graph, AD represents aggregate demand. The usual quantities are measured along the axes of both graphs.  -Refer to Figure 34-2. Assume the money market is always in equilibrium, and suppose r1 = 0.08; r2 = 0.12; Y1 = 13,000; Y2 = 10,000; P1 = 1.0; and P2 = 1.2. Which of the following statements is correct? When P = P2,
(Multiple Choice)
4.8/5 (36)
In a certain economy, when income is $500, consumer spending is $375. The value of the multiplier for this economy is 5. It follows that, when income is $510, consumer spending is
(Multiple Choice)
4.8/5 (38)
If the MPC = 4/5, then the government purchases multiplier is
(Multiple Choice)
4.9/5 (37)
A significant lag for monetary policy is the time it takes to for a change in the money supply to change the economy. A significant lag for fiscal policy is the time it takes to pass legislation authorizing it.
(True/False)
4.8/5 (39)
The Kennedy tax cut of 1964 included an investment tax credit that was designed to
(Multiple Choice)
4.7/5 (42)
In 2009 President Obama and Congress increased government spending. Some economists thought this increase would have little effect on output. Which of the following would make the effect of an increase in government expenditures on aggregate demand smaller?
(Multiple Choice)
4.9/5 (33)
When there is an increase in government expenditures, which of the following raises investment spending?
(Multiple Choice)
4.9/5 (39)
Explain the logic according to liquidity preference theory by which an increase in the money supply changes the aggregate demand curve.
(Essay)
4.9/5 (36)
According to liquidity preference theory, if the price level decreases, then
(Multiple Choice)
5.0/5 (40)
Figure 34-5. On the figure, MS represents money supply and MD represents money demand. 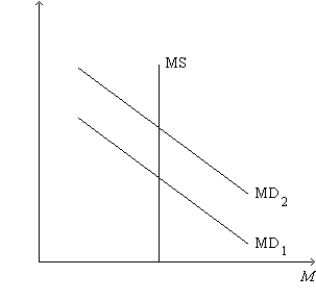 -Refer to Figure 34-5. A shift of the money-demand curve from MD1 to MD2 could be a result of
(Multiple Choice)
4.9/5 (38)
Filters
- Essay(0)
- Multiple Choice(0)
- Short Answer(0)
- True False(0)
- Matching(0)