Exam 34: The Influence of Monetary and Fiscal Policy on Aggregate Demand
Exam 1: Ten Principles of Economics439 Questions
Exam 2: Thinking Like an Economist617 Questions
Exam 3: Interdependence and the Gains From Trade527 Questions
Exam 4: The Market Forces of Supply and Demand697 Questions
Exam 5: Elasticity and Its Application594 Questions
Exam 6: Supply, Demand, and Government Policies645 Questions
Exam 7: Consumers, Producers, and the Efficiency of Markets549 Questions
Exam 8: Application: the Costs of Taxation513 Questions
Exam 9: Application: International Trade492 Questions
Exam 10: Externalities524 Questions
Exam 11: Public Goods and Common Resources433 Questions
Exam 12: The Design of the Tax System549 Questions
Exam 13: The Costs of Production420 Questions
Exam 14: Firms in Competitive Markets543 Questions
Exam 15: Monopoly637 Questions
Exam 16: Monopolistic Competition580 Questions
Exam 17: Oligopoly488 Questions
Exam 18: The Markets for the Factors of Production564 Questions
Exam 19: Earnings and Discrimination490 Questions
Exam 20: Income Inequality and Poverty455 Questions
Exam 21: The Theory of Consumer Choice431 Questions
Exam 22: Frontiers of Microeconomics440 Questions
Exam 23: Measuring a Nations Income520 Questions
Exam 24: Measuring the Cost of Living529 Questions
Exam 25: Production and Growth505 Questions
Exam 26: Saving, Investment, and the Financial System564 Questions
Exam 27: The Basic Tools of Finance500 Questions
Exam 28: Unemployment678 Questions
Exam 29: The Monetary System515 Questions
Exam 30: Money Growth and Inflation481 Questions
Exam 31: Open-Economy Macroeconomics: Basic Concepts522 Questions
Exam 32: A Macroeconomic Theory of the Open Economy475 Questions
Exam 33: Aggregate Demand and Aggregate Supply562 Questions
Exam 34: The Influence of Monetary and Fiscal Policy on Aggregate Demand508 Questions
Exam 35: The Short-Run Trade-Off Between Inflation and Unemployment491 Questions
Exam 36: Six Debates Over Macroeconomic Policy372 Questions
Select questions type
Figure 34-4. On the figure, MS represents money supply and MD represents money demand. 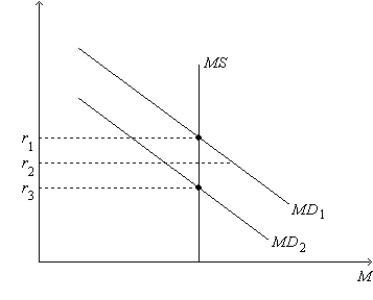 -Refer to Figure 34-4. Which of the following events could explain a shift of the money-demand curve from MD1 to MD2?
(Multiple Choice)
4.8/5  (36)
(36)
Suppose that the government spends more on a missile defense program. What does this do to aggregate demand? How is your answer affected by the presence of the multiplier, crowding-out, taxes, and investment-accelerator effects?
(Essay)
4.9/5 (43)
Figure 34-14 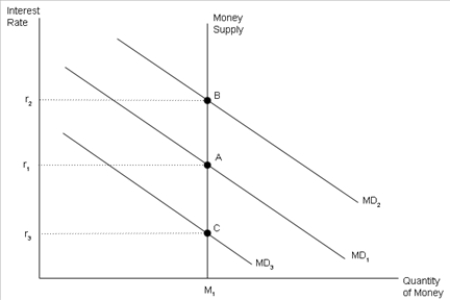 -Refer to Figure 34-14. Households' desired money holdings are given by MD1. If the current rate of interest is r3, then there is excess _____. Households will _____ interest-earning assets, which causes the interest rate to _____.
(Short Answer)
4.8/5 (35)
Scenario 34-1. Take the following information as given for a small, imaginary economy:
-When income is $10,000, consumption spending is $6,500.
-When income is $11,000, consumption spending is $7,250.
-Refer to Scenario 34-1. The multiplier for this economy is
(Multiple Choice)
4.7/5 (32)
According to the theory of liquidity preference, the interest rate adjusts to balance the supply of, and demand for, loanable funds.
(True/False)
4.9/5 (37)
When the Fed increases the money supply, the interest rate decreases. This decrease in the interest rate increases consumption and investment demand, so the aggregate-demand curve shifts to the right.
(True/False)
4.8/5 (42)
When the interest rate decreases, the opportunity cost of holding money
(Multiple Choice)
4.7/5 (39)
Scenario 34-2. The following facts apply to a small, imaginary economy.
-Consumption spending is $6,720 when income is $8,000.
-Consumption spending is $7,040 when income is $8,500.
-Refer to Scenario 34-2. In response to which of the following events could aggregate demand increase by $1,500?
(Multiple Choice)
4.7/5 (41)
When the government reduces taxes, which of the following decreases?
(Multiple Choice)
4.8/5 (39)
The theory of liquidity preference was developed by Irving Fisher.
(True/False)
4.9/5 (38)
Which of the following sequences best represents the crowding-out effect?
(Multiple Choice)
4.7/5 (39)
Changes in the interest rate bring the money market into equilibrium according to
(Multiple Choice)
4.8/5 (30)
In liquidity preference theory, an increase in the interest rate, other things the same, decreases the quantity of money demanded, but does not shift the money demand curve.
(True/False)
4.7/5 (40)
Figure 34-4. On the figure, MS represents money supply and MD represents money demand.
-Refer to Figure 34-4. Suppose the current equilibrium interest rate is r3. Let Y3 represent the corresponding quantity of goods and services demanded, and let P3 represent the corresponding price level. Starting from this situation, if the Federal Reserve decreases the money supply and if the price level remains at P3, then
(Multiple Choice)
4.9/5 (47)
Filters
- Essay(0)
- Multiple Choice(0)
- Short Answer(0)
- True False(0)
- Matching(0)