Exam 15: Chi-Square Tests
Exam 1: Overview of Statistics50 Questions
Exam 2: Data Collection95 Questions
Exam 3: Describing Data Visually108 Questions
Exam 4: Descriptive Statistics134 Questions
Exam 5: Probability121 Questions
Exam 6: Discrete Probability Distributions127 Questions
Exam 7: Continuous Probability Distributions112 Questions
Exam 8: Sampling Distributions and Estimation99 Questions
Exam 9: One-Sample Hypothesis Tests136 Questions
Exam 10: Two-Sample Hypothesis Tests115 Questions
Exam 11: Analysis of Variance141 Questions
Exam 12: Simple Regression120 Questions
Exam 13: Multiple Regression111 Questions
Exam 14: Time-Series Analysis111 Questions
Exam 15: Chi-Square Tests94 Questions
Exam 16: Nonparametric Tests84 Questions
Exam 17: Quality Management103 Questions
Select questions type
Observed frequencies in a chi-square goodness-of-fit test for normality may be less than 5 or even 0 in some cells,as long as the expected frequencies are large enough.
Free
(True/False)
4.7/5  (33)
(33)
Correct Answer: Verified
True
In a goodness-of-fit test,a linear probability plot suggests that the null hypothesis should be rejected.
Free
(True/False)
4.8/5 (25)
Correct Answer:Verified
False
As an independent project,a team of statistics students tabulated the types of vehicles that were parked in four different suburban shopping malls. 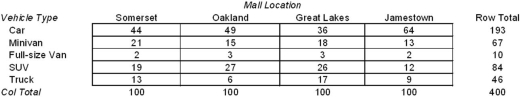 Assuming independence,the expected frequency of SUVs in Jamestown is:
Free
(Multiple Choice)
4.8/5 (30)
Correct Answer:Verified
B
The Oxnard Retailers Anti-Theft Alliance (ORATA)published a study that claimed the causes of disappearance of inventory in retail stores were 30 percent shoplifting,50 percent employee theft,and 20 percent faulty paperwork.The manager of the Melodic Kortholt Outlet performed an audit of the disappearance of 80 items and found the frequencies shown below.She would like to know if her store's experience follows the same pattern as other retailers.  Using α = .05,the critical value you would use in determining whether the Melodic Kortholt's pattern differs from the published study is:
(Multiple Choice)
4.8/5 (28)
In a chi-square test of a 5 × 5 contingency table at α = .05,the critical value is 37.65.
(True/False)
4.8/5 (41)
Based on some ideas expressed in her psychology class,Frieda decided to test a hypothesis about the possible relationship between political views and the number of traffic tickets received.She used a survey of 189 statistics students to prepare the cross-tabulation and chi-square analysis shown below.Discuss Frieda's results using concepts you learned in this chapter.Note any potential problems or concerns in the analysis,and suggest possible improvements. 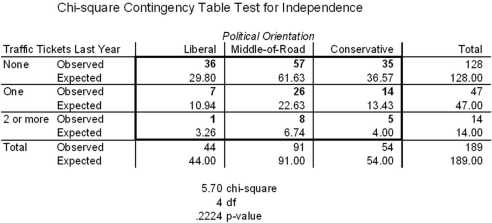
(Essay)
4.8/5 (33)
Students in an introductory college economics class were asked how many credits they had earned in college,and how certain they were about their choice of major.Their replies are summarized below. 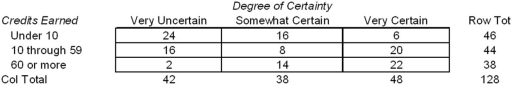 Assuming independence,the expected frequency of very uncertain students with 60 credits or more is:
(Multiple Choice)
4.8/5 (34)
Employees of OxCo Mfg.were surveyed to evaluate the company's pension plan.The table below displays some of the results of the survey. 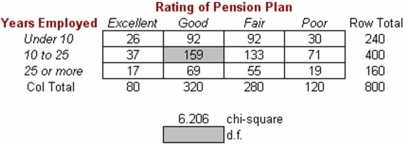 Degrees of freedom for this test (shaded cell below the table)would be:
(Multiple Choice)
4.9/5 (39)
Which of these statements concerning a chi-square goodness-of-fit test is correct?
(Multiple Choice)
4.9/5 (35)
You want to test the hypothesis that the prime rate and inflation are independent.The following table is prepared for the test on the basis of the results of a random sample,collected in various countries and various time periods: 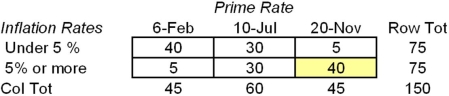 The expected frequency for the shaded cell is:
(Multiple Choice)
4.8/5 (27)
For a chi-square goodness-of-fit test for a uniform distribution with 7 categories,we would use the critical value for 6 degrees of freedom.
(True/False)
4.7/5 (33)
An attraction of the Anderson-Darling test is that it is fairly easy to do without a computer.
(True/False)
4.8/5 (27)
If two variables are independent,we would anticipate a chi-squaretest statistic close to zero.
(True/False)
4.8/5 (35)
A chi-square test of independence is a one-tailed test.The reason is that:
(Multiple Choice)
4.7/5 (32)
A taste test of randomly selected students was conducted to see if there was a difference in preferences among four popular drinks.The following table shows the frequency of responses:  Using α = .025,the critical value of the test you would use in determining whether the preferences are the same among the drinks is:
(Multiple Choice)
4.7/5 (40)
A taste test of randomly selected students was conducted to see if there was a difference in preferences among four popular drinks.The following table shows the frequency of responses:  Using α = .025,what can you conclude from your analysis?
(Multiple Choice)
4.8/5 (41)
For a chi-square goodness-of-fit test for a normal distribution using 7 categories with estimated mean and standard deviation,we would use the critical value for 4 degrees of freedom.
(True/False)
4.9/5 (39)
Filters
- Essay(0)
- Multiple Choice(0)
- Short Answer(0)
- True False(0)
- Matching(0)