Exam 17: Quality Management
Exam 1: Overview of Statistics50 Questions
Exam 2: Data Collection95 Questions
Exam 3: Describing Data Visually108 Questions
Exam 4: Descriptive Statistics134 Questions
Exam 5: Probability121 Questions
Exam 6: Discrete Probability Distributions127 Questions
Exam 7: Continuous Probability Distributions112 Questions
Exam 8: Sampling Distributions and Estimation99 Questions
Exam 9: One-Sample Hypothesis Tests136 Questions
Exam 10: Two-Sample Hypothesis Tests115 Questions
Exam 11: Analysis of Variance141 Questions
Exam 12: Simple Regression120 Questions
Exam 13: Multiple Regression111 Questions
Exam 14: Time-Series Analysis111 Questions
Exam 15: Chi-Square Tests94 Questions
Exam 16: Nonparametric Tests84 Questions
Exam 17: Quality Management103 Questions
Select questions type
Which of the following is most likely the cause of a level shift in a SPC chart?
Free
(Multiple Choice)
4.8/5  (36)
(36)
Correct Answer: Verified
B
A p-chart is a type of process control chart that can be used for plotting the proportion of nonconforming sampled items.
Free
(True/False)
4.9/5 (35)
Correct Answer:Verified
True
If you increase the size of the samples taken when using an  chart,it is necessary to recalculate your control limits because the limits will be wider.
Free
(True/False)
4.9/5 (32)
Correct Answer:Verified
False
Professor Murphy wants to set up a control chart to monitor the percentage of absenteeism in his introductory statistics course (50 students are registered).Absences per period for the last 15 class sessions are in the table below.  Using 3 sigma limits,calculate lower and upper control limits for a p-chart to track absences.
(Multiple Choice)
4.9/5 (38)
If USL = 550,LSL = 540,μ = 545,and σ = 1.75,the process is highly capable.
(True/False)
4.9/5 (35)
Statistical process control charts (SPC charts)are attributed to Shewhart.
(True/False)
4.9/5 (29)
A slow drift of measurements either up or down from the process centerline suggests a:
(Multiple Choice)
4.9/5 (35)
Find the Cpk index for a process with USL = 550,LSL = 540,μ = 545,and σ = 0.75.
(Multiple Choice)
4.8/5 (35)
Which is a rule of thumb to indicate an out-of-control process on the  chart?
(Multiple Choice)
4.8/5 (30)
Ten samples of n = 5 were collected to construct an  chart.The sample mean and range for each sample are shown in the table below.
  Calculate the empirical lower and upper control limits for the
  chart (you will need a table of control chart factors).
(Multiple Choice)
4.7/5 (34)
If the specification subgroup size is n = 4 and the known process parameters are μ = 2.75 and σ = .044,the control limits for the  chart will be:
(Multiple Choice)
4.9/5 (37)
Ten samples of n = 5 were collected to construct an  chart.The sample mean and range for each sample are shown in the table below.
 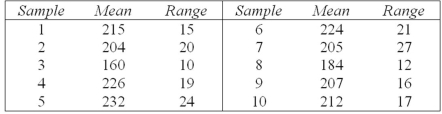 Calculate empirical lower and upper control limits for the R chart (you will need a table of control chart factors).
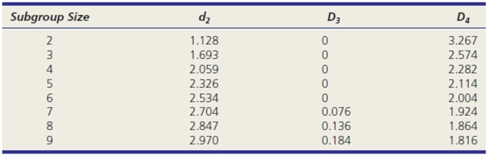
(Multiple Choice)
4.9/5 (36)
What does the fourth letter mean in the Six-Sigma DMAIC acronym?
(Multiple Choice)
4.8/5 (34)
Which is not a true statement about the life and philosophy of W.Edwards Deming?
(Multiple Choice)
4.8/5 (44)
The Cp index equals the Cpk index if USL = 550,LSL = 540,μ = 543,and σ = 0.75.
(True/False)
4.8/5 (31)
In manufacturing,if workers readjust the equipment after each sample,it would typically:
(Multiple Choice)
4.8/5 (32)
Filters
- Essay(0)
- Multiple Choice(0)
- Short Answer(0)
- True False(0)
- Matching(0)