Exam 4: Descriptive Statistics
Exam 1: Overview of Statistics50 Questions
Exam 2: Data Collection95 Questions
Exam 3: Describing Data Visually108 Questions
Exam 4: Descriptive Statistics134 Questions
Exam 5: Probability121 Questions
Exam 6: Discrete Probability Distributions127 Questions
Exam 7: Continuous Probability Distributions112 Questions
Exam 8: Sampling Distributions and Estimation99 Questions
Exam 9: One-Sample Hypothesis Tests136 Questions
Exam 10: Two-Sample Hypothesis Tests115 Questions
Exam 11: Analysis of Variance141 Questions
Exam 12: Simple Regression120 Questions
Exam 13: Multiple Regression111 Questions
Exam 14: Time-Series Analysis111 Questions
Exam 15: Chi-Square Tests94 Questions
Exam 16: Nonparametric Tests84 Questions
Exam 17: Quality Management103 Questions
Select questions type
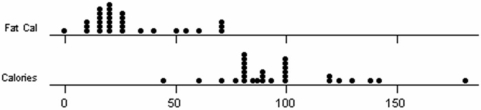
A team of introductory statistics students went to a grocery store and recorded the total calories and fat calories for various kinds of soup.They produced a table of statistics and two dot plots.Write a succinct summary of the center,variability,and shape for each data set.Note: TrimMean is the 5 percent trimmed mean (removing the smallest 5 percent and the largest 5 percent of the values,rounded to the nearest integer. 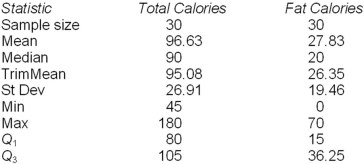
Free
(Essay)
4.9/5  (34)
(34)
Correct Answer: Verified
Both are right-skewed (mean > median)though not greatly so,judging from the dot plots.Trimmed mean is only slightly less than the mean,suggesting that we don't have too many extreme values.However,on the Calories dot plot there is one outlier because z = (180 - 96.63)/26.91 = 3.10.
One disadvantage of the range is that:
Free
(Multiple Choice)
4.8/5 (40)
Correct Answer:Verified
A
The sum of the deviations around the mean is:
Free
(Multiple Choice)
4.8/5 (32)
Correct Answer:Verified
C
Craig operates a part-time snow-plowing business using a 2002 GMC 2500 HD extended cab short box truck.Describe Craig's gasoline mileage based on this histogram of 195 tanks of gas. 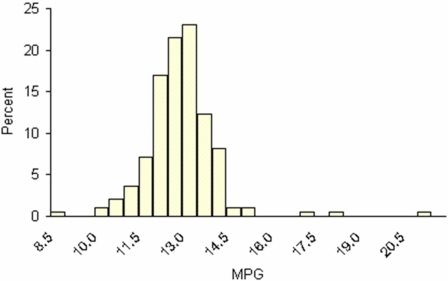
(Essay)
4.8/5 (37)
Three randomly chosen Colorado students were asked how many times they went rock climbing last month.Their replies were 5,6,7.The coefficient of variation is:
(Multiple Choice)
4.8/5 (39)
Chebyshev's Theorem says that at most 50 percent of the data lie within 2 standard deviations of the mean.
(True/False)
4.8/5 (34)
Twelve randomly chosen students were asked how many times they had missed class during a certain semester,with this result: 2,1,5,1,1,3,4,3,1,1,5,18.For this sample,which measure of center is least representative of the "typical" student?
(Multiple Choice)
4.8/5 (36)
In a sample of 10,000 observations from a normal population,how many would you expect to lie beyond three standard deviations of the mean?
(Multiple Choice)
4.8/5 (37)
Consider the following data: 6,7,17,51,3,17,23,and 69.The range and the median are:
(Multiple Choice)
4.8/5 (32)
John scored 35 on Prof.Johnson's exam (Q1 = 70 and Q3 = 80).Based on the fences,which is correct?
(Multiple Choice)
4.8/5 (34)
In a positively skewed distribution,the percentage of observations that fall below the median is:
(Multiple Choice)
4.7/5 (37)
Which statistics offer robust (resistant to outliers)measures of center?
(Multiple Choice)
4.8/5 (37)
Patient survival times after a certain type of surgery have a very right-skewed distribution due to a few high outliers.Consequently,which statement is most likely to be correct?
(Multiple Choice)
4.9/5 (31)
A survey of salary increases received during a recent year by 44 working MBA students is shown.Find the approximate mean percent raise. 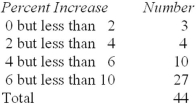
(Multiple Choice)
4.8/5 (30)
Estimate the mean exam score for the 50 students in Prof.Axolotl's class. 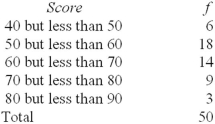
(Multiple Choice)
4.8/5 (32)
Filters
- Essay(0)
- Multiple Choice(0)
- Short Answer(0)
- True False(0)
- Matching(0)