Exam 11: The Determination of Aggregate Output, the Price Level, and the Interest Rate
Exam 1: The Scope and Method of Economics238 Questions
Exam 2: The Economic Problem: Scarcity and Choice220 Questions
Exam 3: Demand, Supply, and Market Equilibrium298 Questions
Exam 4: Demand and Supply Applications173 Questions
Exam 5: Introduction to Macroeconomics241 Questions
Exam 6: Measuring National Output and National Income292 Questions
Exam 7: Unemployment, Inflation, and Long-Run Growth297 Questions
Exam 8: Aggregate Expenditure and Equilibrium Output355 Questions
Exam 9: The Government and Fiscal Policy362 Questions
Exam 10: Money, the Federal Reserve, and the Interest Rate358 Questions
Exam 11: The Determination of Aggregate Output, the Price Level, and the Interest Rate243 Questions
Exam 12: Policy Effects and Cost Shocks in the Asad Model200 Questions
Exam 13: The Labor Market in the Macroeconomy287 Questions
Exam 14: Financial Crises, Stabilization, and Deficits260 Questions
Exam 15: Household and Firm Behavior in the Macroeconomy: a Further Look364 Questions
Exam 16: Long-Run Growth196 Questions
Exam 17: Alternative Views in Macroeconomics294 Questions
Exam 18: International Trade, Comparative Advantage, and Protectionism301 Questions
Exam 19: Open-Economy Macroeconomics: the Balance of Payments and Exchange Rates308 Questions
Exam 20: Economic Growth in Developing Economies133 Questions
Exam 21: Critical Thinking About Research105 Questions
Select questions type
Refer to the information provided in Figure 11.5 below to answer the questions that follow. 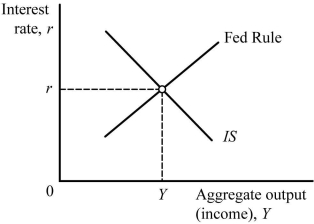 Figure 11.5
-Refer to Figure 11.5. A decrease in government spending shifts the ________ to the ________.
Figure 11.5
-Refer to Figure 11.5. A decrease in government spending shifts the ________ to the ________.
(Multiple Choice)
4.8/5  (37)
(37)
Refer to the information provided in Figure 11.4 below to answer the questions that follow. 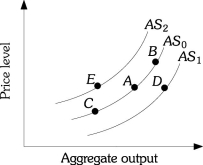 Figure 11.4
-Refer to Figure 11.4. Suppose the economy is at Point A, an increase in the price level moves the economy to Point
Figure 11.4
-Refer to Figure 11.4. Suppose the economy is at Point A, an increase in the price level moves the economy to Point
(Multiple Choice)
4.9/5 (33)
Refer to the information provided in Figure 11.8 below to answer the questions that follow. 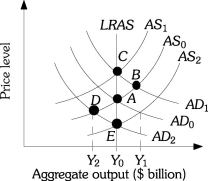 Figure 11.8
-Refer to Figure 11.8. This economy cannot continue to produce Y2 (or at Point D) because
Figure 11.8
-Refer to Figure 11.8. This economy cannot continue to produce Y2 (or at Point D) because
(Multiple Choice)
4.9/5 (36)
When the economy is producing at full capacity, the aggregate supply curve becomes
(Multiple Choice)
4.9/5 (42)
Refer to the information provided in Figure 11.3 below to answer the questions that follow. 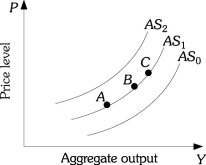 Figure 11.3
-Refer to Figure 11.3. Hurricane Katrina destroyed a large portion of the infrastructure along the Gulf of Mexico coast. This caused
Figure 11.3
-Refer to Figure 11.3. Hurricane Katrina destroyed a large portion of the infrastructure along the Gulf of Mexico coast. This caused
(Multiple Choice)
4.9/5 (35)
When the ________ increases, then potential output increases.
(Multiple Choice)
4.8/5 (38)
An increase in the "Z" factors will decrease the equilibrium price level and decrease aggregate output, ceteris paribus.
(True/False)
4.8/5 (38)
All of the following shift the short-run aggregate supply curve except
(Multiple Choice)
4.8/5 (28)
11.5 The Long-Run AS Curve
Refer to the information provided in Figure 11.7 below to answer the questions that follow. 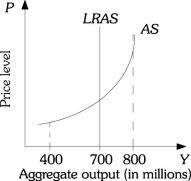 Figure 11.7
-Refer to Figure 11.7. The level of aggregate output that can be sustained in the long run without inflation
Figure 11.7
-Refer to Figure 11.7. The level of aggregate output that can be sustained in the long run without inflation
(Multiple Choice)
4.7/5 (31)
The relationship between the level of prices and the total demand for all goods and services is known as
(Multiple Choice)
4.8/5 (39)
An increase in aggregate demand when the economy is operating at full capacity is likely to result in
(Multiple Choice)
4.9/5 (33)
A decrease in the price level is likely to decrease the aggregate amount of output supplied in the short run because
(Multiple Choice)
4.9/5 (41)
Refer to the information provided in Figure 11.4 below to answer the questions that follow. Figure 11.4
-Refer to Figure 11.4. Which of the following causes the economy to move from Point E to Point A?
(Multiple Choice)
4.9/5 (35)
Which of the following sequence of events follows an open market purchase by the Fed?
(Multiple Choice)
4.9/5 (38)
Refer to the information provided in Figure 11.2 below to answer the questions that follow. 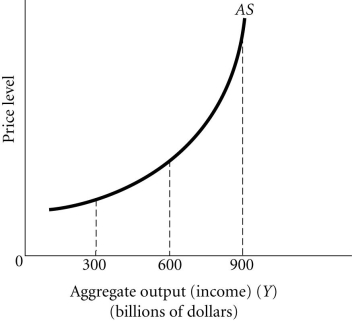 Figure 11.2
-Refer to Figure 11.2. This economy reaches capacity at
Figure 11.2
-Refer to Figure 11.2. This economy reaches capacity at
(Multiple Choice)
4.9/5 (40)
Refer to the information provided in Figure 11.3 below to answer the questions that follow. Figure 11.3
-Refer to Figure 11.3. The increased use of hydraulic fracturing, or fracking, in North Texas has significantly reduced energy prices across the country. This fracking would cause
(Multiple Choice)
4.8/5 (36)
The rationale underlying policies to deregulate the economy is that these policies would
(Multiple Choice)
4.8/5 (29)
Refer to the information provided in Figure 11.8 below to answer the questions that follow. Figure 11.8
-Refer to Figure 11.8. If the economy is currently at Point B producing output level Y1
(Multiple Choice)
4.8/5 (42)
Filters
- Essay(0)
- Multiple Choice(0)
- Short Answer(0)
- True False(0)
- Matching(0)