Exam 11: The Determination of Aggregate Output, the Price Level, and the Interest Rate
Exam 1: The Scope and Method of Economics238 Questions
Exam 2: The Economic Problem: Scarcity and Choice220 Questions
Exam 3: Demand, Supply, and Market Equilibrium298 Questions
Exam 4: Demand and Supply Applications173 Questions
Exam 5: Introduction to Macroeconomics241 Questions
Exam 6: Measuring National Output and National Income292 Questions
Exam 7: Unemployment, Inflation, and Long-Run Growth297 Questions
Exam 8: Aggregate Expenditure and Equilibrium Output355 Questions
Exam 9: The Government and Fiscal Policy362 Questions
Exam 10: Money, the Federal Reserve, and the Interest Rate358 Questions
Exam 11: The Determination of Aggregate Output, the Price Level, and the Interest Rate243 Questions
Exam 12: Policy Effects and Cost Shocks in the Asad Model200 Questions
Exam 13: The Labor Market in the Macroeconomy287 Questions
Exam 14: Financial Crises, Stabilization, and Deficits260 Questions
Exam 15: Household and Firm Behavior in the Macroeconomy: a Further Look364 Questions
Exam 16: Long-Run Growth196 Questions
Exam 17: Alternative Views in Macroeconomics294 Questions
Exam 18: International Trade, Comparative Advantage, and Protectionism301 Questions
Exam 19: Open-Economy Macroeconomics: the Balance of Payments and Exchange Rates308 Questions
Exam 20: Economic Growth in Developing Economies133 Questions
Exam 21: Critical Thinking About Research105 Questions
Select questions type
11.3 The Final Equilibrium
Refer to the information provided in Figure 11.6 below to answer the questions that follow. 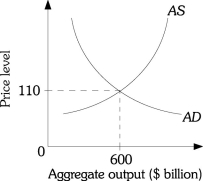 Figure 11.6
-Refer to Figure 11.6. Suppose the equilibrium output is initially $600 billion. An oil embargo would probably
Figure 11.6
-Refer to Figure 11.6. Suppose the equilibrium output is initially $600 billion. An oil embargo would probably
(Multiple Choice)
4.7/5  (34)
(34)
Refer to the information provided in Figure 11.5 below to answer the questions that follow. 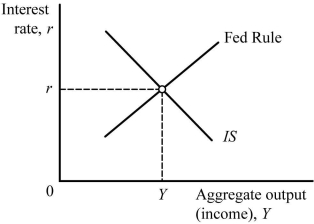 Figure 11.5
-Refer to Figure 11.5. An increase in the Z factors shifts the ________ to the ________.
Figure 11.5
-Refer to Figure 11.5. An increase in the Z factors shifts the ________ to the ________.
(Multiple Choice)
4.8/5 (31)
Other things equal, a decrease in government spending ________ the equilibrium interest rate and ________ equilibrium output.
(Multiple Choice)
4.8/5 (35)
The real wealth effect explains why the aggregate supply curve is horizontal in the long run.
(True/False)
4.7/5 (29)
Refer to the information provided in Figure 11.8 below to answer the questions that follow. 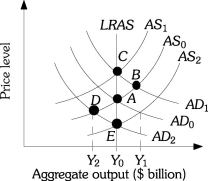 Figure 11.8
-Refer to Figure 11.8. Suppose the economy is currently at Point A producing potential output Y0. If the government increases spending, the economy moves to Point ________ in the short-run and to Point ________ in the long-run.
Figure 11.8
-Refer to Figure 11.8. Suppose the economy is currently at Point A producing potential output Y0. If the government increases spending, the economy moves to Point ________ in the short-run and to Point ________ in the long-run.
(Multiple Choice)
4.8/5 (39)
Related to the Economics in Practice on p. 221: In January 2014, a new Chair of the Board of Governors of the Federal Reserve System was confirmed. This person is
(Multiple Choice)
4.7/5 (38)
The aggregate supply curve is probably better thought of as a price/output response curve.
(True/False)
4.9/5 (44)
Refer to the information provided in Figure 11.2 below to answer the questions that follow. 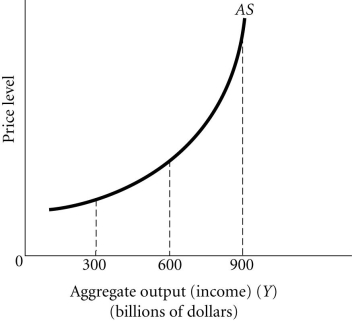 Figure 11.2
-Refer to Figure 11.2. At $900 billion, this economy
Figure 11.2
-Refer to Figure 11.2. At $900 billion, this economy
(Multiple Choice)
4.9/5 (32)
As the interest rate decreases, the planned aggregate expenditure curve shifts downward.
(True/False)
4.8/5 (29)
Refer to the information provided in Figure 11.5 below to answer the questions that follow. Figure 11.5
-Refer to Figure 11.5. A decrease in the Z factors shifts the ________ to the ________.
(Multiple Choice)
4.9/5 (27)
Refer to the information provided in Figure 11.4 below to answer the questions that follow. 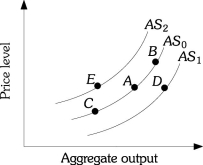 Figure 11.4
-Refer to Figure 11.4. Suppose the economy is at Point A, an increase in aggregate demand moves the economy to Point
Figure 11.4
-Refer to Figure 11.4. Suppose the economy is at Point A, an increase in aggregate demand moves the economy to Point
(Multiple Choice)
4.9/5 (37)
11.5 The Long-Run AS Curve
Refer to the information provided in Figure 11.7 below to answer the questions that follow. 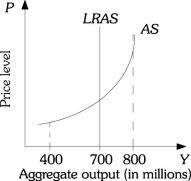 Figure 11.7
-Refer to Figure 11.7. $700 million is the level of aggregate output that can be sustained in the long run
Figure 11.7
-Refer to Figure 11.7. $700 million is the level of aggregate output that can be sustained in the long run
(Multiple Choice)
4.9/5 (38)
A decrease in government spending shifts aggregate demand to the left.
(True/False)
4.7/5 (36)
The aggregate demand curve is the sum of all market demand curves in the economy.
(True/False)
4.9/5 (32)
Related to the Economics in Practice on p. 227: In the simple "Keynesian" view, if planned aggregate expenditure and aggregate demand exceed capacity output, there is
(Multiple Choice)
4.8/5 (30)
An increase in aggregate demand when the economy is operating at ________ is likely to result in an increase in the overall price level and ________ in output.
(Multiple Choice)
4.9/5 (31)
Refer to the information provided in Figure 11.1 below to answer the questions that follow.  Figure 11.1
-Refer to Figure 11.1. This economy is most likely experiencing excess capacity at aggregate output levels
Figure 11.1
-Refer to Figure 11.1. This economy is most likely experiencing excess capacity at aggregate output levels
(Multiple Choice)
4.8/5 (26)
When the interest rate is low, planned investment is ________ so output is ________.
(Multiple Choice)
4.9/5 (35)
Filters
- Essay(0)
- Multiple Choice(0)
- Short Answer(0)
- True False(0)
- Matching(0)