Exam 11: The Determination of Aggregate Output, the Price Level, and the Interest Rate
Exam 1: The Scope and Method of Economics238 Questions
Exam 2: The Economic Problem: Scarcity and Choice220 Questions
Exam 3: Demand, Supply, and Market Equilibrium298 Questions
Exam 4: Demand and Supply Applications173 Questions
Exam 5: Introduction to Macroeconomics241 Questions
Exam 6: Measuring National Output and National Income292 Questions
Exam 7: Unemployment, Inflation, and Long-Run Growth297 Questions
Exam 8: Aggregate Expenditure and Equilibrium Output355 Questions
Exam 9: The Government and Fiscal Policy362 Questions
Exam 10: Money, the Federal Reserve, and the Interest Rate358 Questions
Exam 11: The Determination of Aggregate Output, the Price Level, and the Interest Rate243 Questions
Exam 12: Policy Effects and Cost Shocks in the Asad Model200 Questions
Exam 13: The Labor Market in the Macroeconomy287 Questions
Exam 14: Financial Crises, Stabilization, and Deficits260 Questions
Exam 15: Household and Firm Behavior in the Macroeconomy: a Further Look364 Questions
Exam 16: Long-Run Growth196 Questions
Exam 17: Alternative Views in Macroeconomics294 Questions
Exam 18: International Trade, Comparative Advantage, and Protectionism301 Questions
Exam 19: Open-Economy Macroeconomics: the Balance of Payments and Exchange Rates308 Questions
Exam 20: Economic Growth in Developing Economies133 Questions
Exam 21: Critical Thinking About Research105 Questions
Select questions type
The change in consumption brought about by a change in purchasing power of savings that results from a change in the price level is the
(Multiple Choice)
4.9/5  (38)
(38)
11.5 The Long-Run AS Curve
Refer to the information provided in Figure 11.7 below to answer the questions that follow. 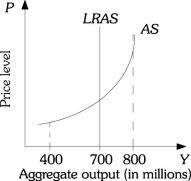 Figure 11.7
-Refer to Figure 11.7. Potential output
Figure 11.7
-Refer to Figure 11.7. Potential output
(Multiple Choice)
5.0/5 (34)
Since aggregate supply is the total supply of all goods and services in the economy, the aggregate supply curve is the sum of the individual supply curves for each of these goods and services.
(True/False)
4.8/5 (37)
Decreasing government spending and decreasing the minimum wage are two policies that both work to decrease the price level.
(True/False)
4.8/5 (31)
The aggregate demand curve is the sum of all demand curves of all goods and services in the economy.
(True/False)
4.9/5 (42)
Refer to the information provided in Figure 11.5 below to answer the questions that follow. 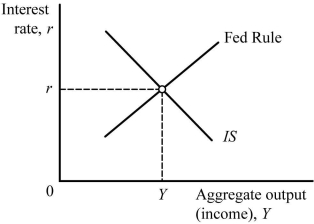 Figure 11.5
-Refer to Figure 11.5. Which of the following combinations would definitely increase the equilibrium interest rate?
Figure 11.5
-Refer to Figure 11.5. Which of the following combinations would definitely increase the equilibrium interest rate?
(Multiple Choice)
4.8/5 (36)
Which of the following will, unambiguously, increase the price level?
(Multiple Choice)
4.9/5 (35)
Aggregate demand is the total demand for goods and services in an entire economy.
(True/False)
4.9/5 (37)
Refer to the information provided in Figure 11.8 below to answer the questions that follow. 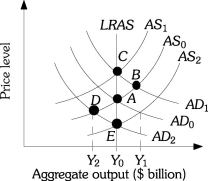 Figure 11.8
-Refer to Figure 11.8. Suppose the economy is currently at Point A producing potential output Y0. If the government decreases spending, the economy moves to Point ________ in the short run and to Point ________ in the long run.
Figure 11.8
-Refer to Figure 11.8. Suppose the economy is currently at Point A producing potential output Y0. If the government decreases spending, the economy moves to Point ________ in the short run and to Point ________ in the long run.
(Multiple Choice)
4.8/5 (37)
An increase in oil prices will increase the equilibrium price level and decrease aggregate output, ceteris paribus.
(True/False)
4.9/5 (36)
The graph that shows the relationship between the aggregate quantity of output supplied by all the firms in an economy and the overall price level is
(Multiple Choice)
4.8/5 (39)
Refer to the information provided in Figure 11.4 below to answer the questions that follow. 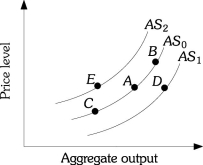 Figure 11.4
-Refer to Figure 11.4. Suppose the economy is at Point A, an oil price decrease could move the economy to Point
Figure 11.4
-Refer to Figure 11.4. Suppose the economy is at Point A, an oil price decrease could move the economy to Point
(Multiple Choice)
4.9/5 (29)
If the United States were to pass legislation that would make it easier for people to emigrate to the United States, this would cause
(Multiple Choice)
4.8/5 (32)
When the aggregate supply curve is ________ any increase in the price level will not cause an increase in aggregate output.
(Multiple Choice)
4.7/5 (25)
A movement up the aggregate supply curve is caused by a(n)
(Multiple Choice)
4.8/5 (34)
Government spending is a variable that is exogenous to the AS/AD model.
(True/False)
4.7/5 (37)
An increase in the price level cause aggregate demand to increase.
(True/False)
4.8/5 (40)
Refer to the information provided in Figure 11.4 below to answer the questions that follow. Figure 11.4
-Refer to Figure 11.4. Which of the following causes the economy to move from Point A to Point E?
(Multiple Choice)
4.8/5 (38)
Refer to the information provided in Figure 11.4 below to answer the questions that follow. Figure 11.4
-Refer to Figure 11.4. Suppose the economy is at Point A, a decrease in aggregate demand moves the economy to Point
(Multiple Choice)
4.8/5 (36)
Filters
- Essay(0)
- Multiple Choice(0)
- Short Answer(0)
- True False(0)
- Matching(0)