Exam 1: The Scope and Method of Economics
Exam 1: The Scope and Method of Economics238 Questions
Exam 2: The Economic Problem: Scarcity and Choice220 Questions
Exam 3: Demand, Supply, and Market Equilibrium298 Questions
Exam 4: Demand and Supply Applications173 Questions
Exam 5: Introduction to Macroeconomics241 Questions
Exam 6: Measuring National Output and National Income292 Questions
Exam 7: Unemployment, Inflation, and Long-Run Growth297 Questions
Exam 8: Aggregate Expenditure and Equilibrium Output355 Questions
Exam 9: The Government and Fiscal Policy362 Questions
Exam 10: Money, the Federal Reserve, and the Interest Rate358 Questions
Exam 11: The Determination of Aggregate Output, the Price Level, and the Interest Rate243 Questions
Exam 12: Policy Effects and Cost Shocks in the Asad Model200 Questions
Exam 13: The Labor Market in the Macroeconomy287 Questions
Exam 14: Financial Crises, Stabilization, and Deficits260 Questions
Exam 15: Household and Firm Behavior in the Macroeconomy: a Further Look364 Questions
Exam 16: Long-Run Growth196 Questions
Exam 17: Alternative Views in Macroeconomics294 Questions
Exam 18: International Trade, Comparative Advantage, and Protectionism301 Questions
Exam 19: Open-Economy Macroeconomics: the Balance of Payments and Exchange Rates308 Questions
Exam 20: Economic Growth in Developing Economies133 Questions
Exam 21: Critical Thinking About Research105 Questions
Select questions type
Normative economics questions "What ought to be?" Positive economics predicts the consequences of alternative actions, answering the questions "What is?" or "What will be?"
(True/False)
4.9/5  (30)
(30)
Refer to the information provided in Figure 1.7 below to answer the questions that follow. 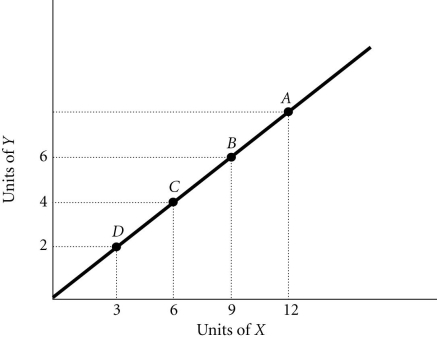 Figure 1.7
-Refer to Figure 1.7. If a 45-degree line were also graphed, it would ________ the line shown on the graph.
Figure 1.7
-Refer to Figure 1.7. If a 45-degree line were also graphed, it would ________ the line shown on the graph.
(Multiple Choice)
4.9/5 (35)
Refer to the information provided in Figure 1.4 below to answer the questions that follow. 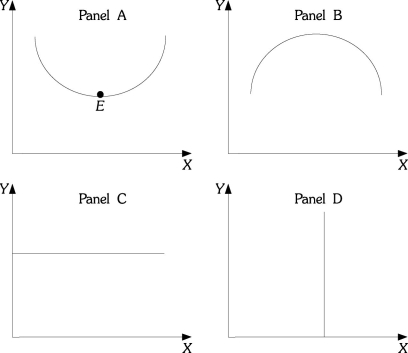 Figure 1.4
-Refer to Figure 1.4. At Point E in panel A, the slope is
Figure 1.4
-Refer to Figure 1.4. At Point E in panel A, the slope is
(Multiple Choice)
4.9/5 (31)
The statement "people should pollute as little as possible" is an example of a
(Multiple Choice)
5.0/5 (27)
Refer to the information provided in Figure 1.4 below to answer the questions that follow. Figure 1.4
-Refer to Figure 1.4. Which of the Panels shows a curve or line that has a zero slope throughout?
(Multiple Choice)
4.9/5 (43)
Since the legal age to vote in the United States is 18, the legal drinking age in the United States should be lowered to 18. This statement is best described as
(Multiple Choice)
4.9/5 (33)
You have decided that you want to attend a renaissance fair as King Henry VIII. You estimate that it will cost $80 to assemble your costume. After spending $80 on the costume, you realize that the additional pieces you need will cost you $20 more. The marginal cost of completing the costume is
(Multiple Choice)
4.8/5 (42)
Related to the Economics in Practice on page 9: Prior to joining a fraternity, James spent most of his evenings and weekends studying for his classes. Once he joined the fraternity, James spent a majority of his evenings and weekends going to parties. This change in behavior is best described by
(Multiple Choice)
4.8/5 (32)
________ economy is an economy that produces what consumers demand and does so at the least possible cost.
(Multiple Choice)
4.9/5 (28)
Positive economics looks at outcomes of economic behavior and evaluates them as good or bad.
(True/False)
4.9/5 (33)
There is a possibility that a national sales tax will be implemented. Many economists argue that items such as food and clothing should be exempt from such a tax because low-income people spend a greater percentage of their income on these goods than do high-income individuals. This argument is motivated by concerns over
(Multiple Choice)
4.9/5 (39)
A graph illustrating how a variable changes over time is called a time-series graph.
(True/False)
4.8/5 (35)
Many economists argue that items such as food and clothing should be exempt from sales tax because low-income people spend a greater percentage of their income on these goods than do high-income individuals. This argument is motivated by concerns over
(Multiple Choice)
4.8/5 (37)
Refer to the information provided in Figure 1.4 below to answer the questions that follow. Figure 1.4
-Refer to Figure 1.4. Panel A shows a curve which has a slope that is
(Multiple Choice)
4.7/5 (41)
The mistake of inferring causality from ________ is called the post hoc, ergo propter hoc fallacy.
(Multiple Choice)
4.9/5 (30)
Refer to Scenario 1.2 below to answer the questions that follow.
SCENARIO 1.2: A scientist wants to understand the relationship between automobile emissions and the level of global warming. The scientist collects data on the volume of automobile emissions and the levels of global warming over time. The scientist concludes that a 1% increase in automobile emissions causes a 0.0003% increase in average global temperatures. From this information he concludes that the automobile emissions are harmful to the environment and should be reduced to stop the increase in global temperatures.
-Refer to Scenario 1.2. The collection and use of the data on automobile emissions and global warming levels is an example of
(Multiple Choice)
4.8/5 (37)
Filters
- Essay(0)
- Multiple Choice(0)
- Short Answer(0)
- True False(0)
- Matching(0)