Exam 1: The Scope and Method of Economics
Exam 1: The Scope and Method of Economics238 Questions
Exam 2: The Economic Problem: Scarcity and Choice220 Questions
Exam 3: Demand, Supply, and Market Equilibrium298 Questions
Exam 4: Demand and Supply Applications173 Questions
Exam 5: Introduction to Macroeconomics241 Questions
Exam 6: Measuring National Output and National Income292 Questions
Exam 7: Unemployment, Inflation, and Long-Run Growth297 Questions
Exam 8: Aggregate Expenditure and Equilibrium Output355 Questions
Exam 9: The Government and Fiscal Policy362 Questions
Exam 10: Money, the Federal Reserve, and the Interest Rate358 Questions
Exam 11: The Determination of Aggregate Output, the Price Level, and the Interest Rate243 Questions
Exam 12: Policy Effects and Cost Shocks in the Asad Model200 Questions
Exam 13: The Labor Market in the Macroeconomy287 Questions
Exam 14: Financial Crises, Stabilization, and Deficits260 Questions
Exam 15: Household and Firm Behavior in the Macroeconomy: a Further Look364 Questions
Exam 16: Long-Run Growth196 Questions
Exam 17: Alternative Views in Macroeconomics294 Questions
Exam 18: International Trade, Comparative Advantage, and Protectionism301 Questions
Exam 19: Open-Economy Macroeconomics: the Balance of Payments and Exchange Rates308 Questions
Exam 20: Economic Growth in Developing Economies133 Questions
Exam 21: Critical Thinking About Research105 Questions
Select questions type
A graph illustrating how one variable changes over time is a Cartesian coordinate system.
(True/False)
4.9/5  (36)
(36)
The government should extend the duration of unemployment benefits to those workers who lost their jobs due to outsourcing. This statement is best described as
(Multiple Choice)
4.8/5 (35)
Which of the following is an example of a normative statement?
(Multiple Choice)
4.9/5 (34)
Refer to the information provided in Figure 1.7 below to answer the questions that follow. 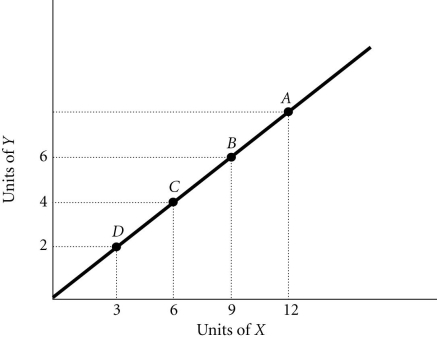 Figure 1.7
-The slope of a horizontal line is
Figure 1.7
-The slope of a horizontal line is
(Multiple Choice)
4.9/5 (33)
To isolate the impact of one single factor, economists invoke the assumption of
(Multiple Choice)
4.8/5 (34)
Refer to Scenario 1.2 below to answer the questions that follow.
SCENARIO 1.2: A scientist wants to understand the relationship between automobile emissions and the level of global warming. The scientist collects data on the volume of automobile emissions and the levels of global warming over time. The scientist concludes that a 1% increase in automobile emissions causes a 0.0003% increase in average global temperatures. From this information he concludes that the automobile emissions are harmful to the environment and should be reduced to stop the increase in global temperatures.
-Refer to Scenario 1.2. The statement that a 1% increase in the automobile emissions causes a 0.0003% increase in average global temperatures is an example of
(Multiple Choice)
4.9/5 (36)
Related to the Economics in Practice on p. 9: Based on a study of the effects of roommates on college grades discussed in the Economics in Practice, which of the following is true?
(Multiple Choice)
4.8/5 (39)
Refer to the information provided in Figure 1.7 below to answer the questions that follow. Figure 1.7
-The slope of a vertical line is
(Multiple Choice)
4.9/5 (33)
An approach to economics that applies statistical techniques and data to economic problems is called
(Multiple Choice)
4.8/5 (39)
Marco observed that every time the temperature rises above 90 degrees, he forgets to take out the trash. Based on this observation he concluded that temperatures above 90 degrees result in temporary memory loss. In actuality, Marco
(Multiple Choice)
4.8/5 (39)
Refer to Scenario 1.2 below to answer the questions that follow.
SCENARIO 1.2: A scientist wants to understand the relationship between automobile emissions and the level of global warming. The scientist collects data on the volume of automobile emissions and the levels of global warming over time. The scientist concludes that a 1% increase in automobile emissions causes a 0.0003% increase in average global temperatures. From this information he concludes that the automobile emissions are harmful to the environment and should be reduced to stop the increase in global temperatures.
-Refer to Scenario 1.2. A graph of the volume of automobile emissions on one axis and the level of average global temperatures on the other axis is an example of
(Multiple Choice)
4.9/5 (36)
If you own a building and you decide to use that building to open a book store,
(Multiple Choice)
4.8/5 (30)
Refer to Scenario 1.1 below to answer the questions that follow.
SCENARIO 1.1: An economist wants to understand the relationship between minimum wages and the level of teenage unemployment. The economist collects data on the values of the minimum wage and the levels of teenage unemployment over time. The economist concludes that a 1% increase in minimum wage causes a 0.2% increase in teenage unemployment. From this information he concludes that the minimum wage is harmful to teenagers and should be reduced or eliminated to increase employment among teenagers.
-Refer to Scenario 1.1. A graph of the value of the minimum wage on one axis and the level of teenage unemployment on the other axis is an example of
(Multiple Choice)
4.9/5 (33)
The Latin phrase ceteris paribus means that when a relationship between two variables is being studied
(Multiple Choice)
4.9/5 (47)
Refer to the information provided in Figure 1.7 below to answer the questions that follow. Figure 1.7
-Refer to Figure 1.7. At Point A the slope of the line is 0.67, so at Point C the slope would be
(Multiple Choice)
4.8/5 (44)
Filters
- Essay(0)
- Multiple Choice(0)
- Short Answer(0)
- True False(0)
- Matching(0)