Exam 14: Regression Analysis
Exam 1: Statistics and Data100 Questions
Exam 2: Tabular and Graphical Methods123 Questions
Exam 3: Numerical Descriptive Measures151 Questions
Exam 4: Basic Probability Concepts116 Questions
Exam 5: Discrete Probability Distributions139 Questions
Exam 6: Continuous Probability Distributions128 Questions
Exam 7: Sampling and Sampling Distributions124 Questions
Exam 8: Interval Estimation123 Questions
Exam 9: Hypothesis Testing135 Questions
Exam 10: Statistical Inference Concerning Two Populations124 Questions
Exam 11: Statistical Inference Concerning Variance111 Questions
Exam 12: Chi-Square Tests120 Questions
Exam 13: Analysis of Variance58 Questions
Exam 14: Regression Analysis140 Questions
Exam 15: Inference With Regression Models124 Questions
Exam 16: Regression Models for Nonlinear Relationships115 Questions
Exam 17: Regression Models With Dummy Variables114 Questions
Exam 18: Time Series and Forecasting124 Questions
Exam 19: Returns, Index Numbers and Inflation120 Questions
Exam 20: Nonparametric Tests108 Questions
Select questions type
When two regression models applied on the same data set have the same response variable but a different number of explanatory variables,the model that would evidently provide the better fit is the one with a __________.
(Multiple Choice)
4.8/5  (29)
(29)
Consider the following sample regression equation  = 200 + 10x,where y is the supply for Product A (in 1000s)(in 1,000s)and x is the price of Product A (in $).If the price of Product A increases by $3,then we expect the supply for Product A to _______________.
(Multiple Choice)
4.7/5 (32)
The correlation coefficient could be considered as a "standardized covariance."
(True/False)
4.9/5 (33)
If _____ is substantially greater than zero and the number of explanatory variables is large compared with sample size,then the adjusted R2 will differ substantially from R2.
(Essay)
4.8/5 (41)
Which of the following identifies the range for a correlation coefficient?
(Multiple Choice)
4.8/5 (37)
The following data for five years of the annual returns for two of Vanguard's mutual funds,the Vanguard Energy Fund (x)and the Vanguard Healthcare Fund (y),were given as sx = 35.77,sy = 13.34,sxy = 447.68.Which of the following is the value of the sample correlation coefficient?
(Multiple Choice)
4.8/5 (37)
Consider the following sample data: 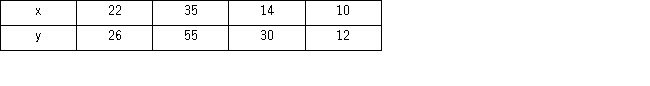 a.Construct a scatterplot.
b.Calculate b1 and b0.What is the sample regression equation?
c.Find the predicted value for y if x equals 10,15,and 20.
a.Construct a scatterplot.
b.Calculate b1 and b0.What is the sample regression equation?
c.Find the predicted value for y if x equals 10,15,and 20.
(Essay)
4.9/5 (32)
Compared to the sample correlation coefficient,the sample covariance is a better measure to gauge the strength of the linear relationship between two variables.
(True/False)
4.9/5 (31)
Using the same data set,four models are estimated using the same response variable,however,the number of explanatory variables differs.Which of the following models provides the best fit? 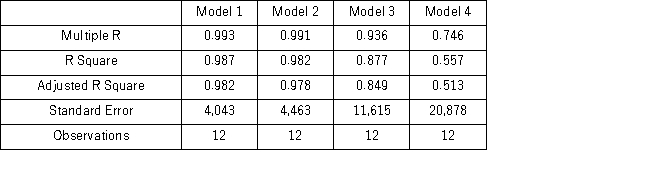
(Multiple Choice)
4.8/5 (31)
The following scatterplot indicates that the relationship between the two variables x and y is ______________. 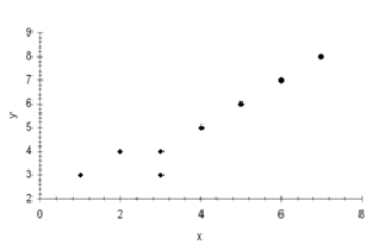
(Multiple Choice)
4.7/5 (39)
Consider the following simple linear regression model: y = β0 + β1x +ε.The random error term is ____.
(Multiple Choice)
4.8/5 (34)
Consider the following sample regression equation  = 150 - 20x,where y is the demand for Product A (in 1,000s)and x is the price of the product (in $).The slope coefficient indicates that if ______________.
(Multiple Choice)
4.7/5 (31)
The following scatterplot indicates that the relationship between the two variables x and y is _______________. 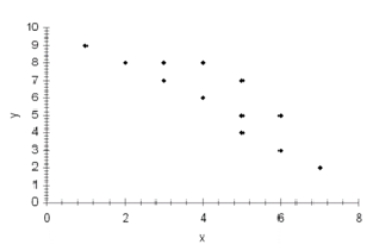
(Multiple Choice)
5.0/5 (38)
In the simple linear regression model,β0 is the y-intercept of the line y =β0 + β1x+ ε.
(True/False)
4.9/5 (33)
What is the name of the variable that is used to predict another variable?
(Multiple Choice)
4.8/5 (35)
In a simple linear regression model,if the plots on a scatter diagram lie on a straight line,which of the following is the standard error of the estimate?
(Multiple Choice)
5.0/5 (39)
When estimating  = β0 + β1x1 + β2x2 +ε,the following regression results using ANOVA were obtained.
 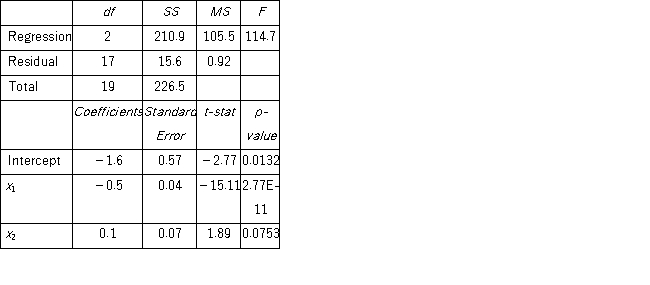 Which of the following is the adjusted R2?
(Multiple Choice)
4.8/5 (33)
An economist examines the relationship between the number of patent applications filed and expenditures in research and development (Ramp;D)for the 50 states and the District of Columbia.She believes that if a state spends more on research and development,then more patents will be filed.She estimates the following model:  ,where Patents is the number of patent applications filed and R&D is the state's expenditures on research and development (in $1,000,000s).The regression results are shown in the accompanying table.
 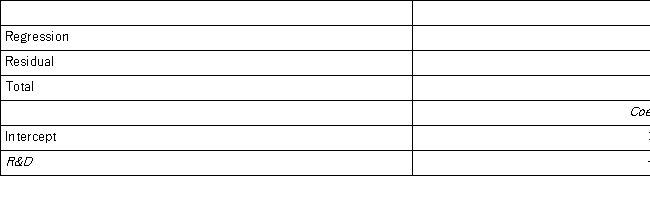 a.Predict the number of patents filed for a state that spends $5,000,000 on R&D.
b.Interpret the coefficient attached to R&D.
c.Calculate the standard error of the estimate.
d.Interpret the coefficient of determination.
a.Predict the number of patents filed for a state that spends $5,000,000 on R&D.
b.Interpret the coefficient attached to R&D.
c.Calculate the standard error of the estimate.
d.Interpret the coefficient of determination.
(Essay)
4.7/5 (36)
Given the augmented Phillips model: Given the augmented Phillips model: y = β0 + β1x1+β2x2 +ε,where y = actual rate of inflation (%),x1 = unemployment rate (%),and x2 = anticipated inflation rate (%).The response variable or variables(s)in this model is (are)the ___________________.
(Multiple Choice)
4.8/5 (35)
Filters
- Essay(0)
- Multiple Choice(0)
- Short Answer(0)
- True False(0)
- Matching(0)