Exam 3: Numerical Descriptive Measures
Exam 1: Statistics and Data100 Questions
Exam 2: Tabular and Graphical Methods123 Questions
Exam 3: Numerical Descriptive Measures151 Questions
Exam 4: Basic Probability Concepts116 Questions
Exam 5: Discrete Probability Distributions139 Questions
Exam 6: Continuous Probability Distributions128 Questions
Exam 7: Sampling and Sampling Distributions124 Questions
Exam 8: Interval Estimation123 Questions
Exam 9: Hypothesis Testing135 Questions
Exam 10: Statistical Inference Concerning Two Populations124 Questions
Exam 11: Statistical Inference Concerning Variance111 Questions
Exam 12: Chi-Square Tests120 Questions
Exam 13: Analysis of Variance58 Questions
Exam 14: Regression Analysis140 Questions
Exam 15: Inference With Regression Models124 Questions
Exam 16: Regression Models for Nonlinear Relationships115 Questions
Exam 17: Regression Models With Dummy Variables114 Questions
Exam 18: Time Series and Forecasting124 Questions
Exam 19: Returns, Index Numbers and Inflation120 Questions
Exam 20: Nonparametric Tests108 Questions
Select questions type
The following data are a list of the magnitudes of six of Alaska's largest recorded earthquakes.
9.2 7.9 8.7 8.6 7.9 8.1
Calculate the mean,median,and mode of the magnitude of Alaska's Earthquakes.
Free
(Essay)
4.9/5  (39)
(39)
Correct Answer: Verified
The sample mean is computed as  The median is the middle value of a data set.The mode is the most frequently occurring value in a data set.
In a marketing class of 60 students,the mean and the standard deviation of scores was 70 and 5,respectively.Use Chebyshev's theorem to determine the number of students who scored less than 60 or more than 80.
Free
(Multiple Choice)
4.9/5 (39)
Correct Answer:Verified
B
Calculate the mean,median,and mode of the sample data below.
6 3 9 5 3 7 8 1
Free
(Essay)
4.8/5 (31)
Correct Answer:Verified
The sample mean is computed as  The median is the middle value of a data set.The mode is the most frequently occurring value in a data set.
Sales for Adidas grew at a rate of 0.5196 in 2006,0.0213 in 2007,0.0485 in 2008,and -0.0387 in 2009.The average growth rate for Adidas during these four years is the closest to _______.
(Multiple Choice)
5.0/5 (40)
Which of the following statements about the mean absolute deviation (MAD)is themost accurate?
(Multiple Choice)
4.9/5 (34)
The mean starting salary of recent business graduates at a university is $52,000 with a standard deviation of $16,000.The distribution of starting salaries is assumed to be symmetric and bell-shaped.
a.What proportion of business graduates has a starting salary between $20,000 and $84,000.
b.Suppose 600 business graduates from this university got hired.How many of them started with a salary between $20,000 and $84,000?
(Essay)
4.8/5 (33)
For k> 1,Chebyshev's theorem is useful in estimating the proportion of observations that fall within ________________________________.
(Multiple Choice)
4.9/5 (36)
The Yearly Prices (rounded to the nearest dollar)for GLD (a gold exchange traded fund)and SLV (a silver exchange traded fund)are reported in the following table.  Calculate the sample variance and sample standard deviation for the GLD ETF and SLV ETF.
b.Which asset had a greater variance?
c.Which asset had the greater relative dispersion?
Calculate the sample variance and sample standard deviation for the GLD ETF and SLV ETF.
b.Which asset had a greater variance?
c.Which asset had the greater relative dispersion?
(Essay)
4.9/5 (33)
Chebyshev's theorem is applicable when the data are___________________.
(Multiple Choice)
4.9/5 (35)
The _______ identifies the number of standard deviations a particular value is from the mean of its distribution.
(Multiple Choice)
4.8/5 (36)
Calculate the interquartile range from the following data: 1,2,4,5,10,12,18.
(Multiple Choice)
4.8/5 (29)
Professors at a local university earn an average salary of $80,000 with a standard deviation of $6,000.With the beginning of the next academic year,all professors will get a 2% raise.What will be the average and the standard deviation of their new salaries?
(Multiple Choice)
4.8/5 (40)
The director of graduate admissions is analyzing the relationship between scores in the Graduate Record Examination(GRE)and student performance in graduate school,as measured by a student's GPA.The table below shows a sample of 10 students. 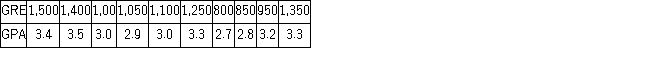 The covariance is ______.
(Multiple Choice)
4.9/5 (36)
The table below gives the deviations of a portfolio's annual total returns from its benchmark's annual returns,for a 6-year period ending in 2011. 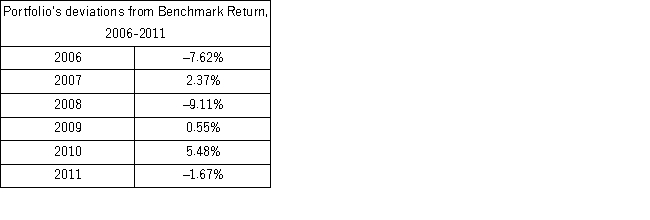 The arithmetic mean return and median return are the closest to _______.
(Multiple Choice)
4.8/5 (36)
A bowler's scores for a sample of six games were 172 168 188 190 172 182 174.
The sample standard deviation is the closest to _____.
(Multiple Choice)
4.9/5 (38)
Professors at a local university earn an average salary of $80,000 with a standard deviation of $6,000.The salary distribution cannot be regarded as bell-shaped.What can be said about the percentage of salaries that are less than $68,000 or more than or more than $92,000?
(Multiple Choice)
4.8/5 (40)
A surfer visited his favorite beach 50 times and recorded the wave height each time in the following table. 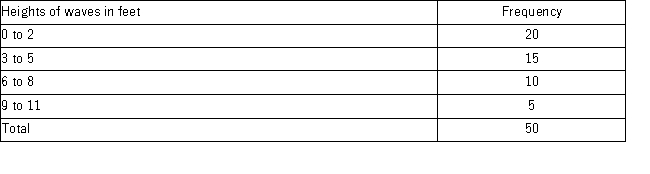 a.Calculate the average wave height.
b.Calculate the variance and standard deviation wave height for this sample.
a.Calculate the average wave height.
b.Calculate the variance and standard deviation wave height for this sample.
(Essay)
4.7/5 (39)
The following sample data shows the starting salaries of six graduates from the accounting program at California Polytechnic State University.The data are in thousands of dollars.
24 46 48 52 56 58 60
a.Calculate and interpret the 25th,50th,and 75th percentiles.
b.Are there any outliers?Is the distribution symmetric?If not,comment on its skewness.
(Essay)
4.9/5 (32)
Filters
- Essay(0)
- Multiple Choice(0)
- Short Answer(0)
- True False(0)
- Matching(0)