Exam 14: Regression Analysis
Exam 1: Statistics and Data100 Questions
Exam 2: Tabular and Graphical Methods123 Questions
Exam 3: Numerical Descriptive Measures151 Questions
Exam 4: Basic Probability Concepts116 Questions
Exam 5: Discrete Probability Distributions139 Questions
Exam 6: Continuous Probability Distributions128 Questions
Exam 7: Sampling and Sampling Distributions124 Questions
Exam 8: Interval Estimation123 Questions
Exam 9: Hypothesis Testing135 Questions
Exam 10: Statistical Inference Concerning Two Populations124 Questions
Exam 11: Statistical Inference Concerning Variance111 Questions
Exam 12: Chi-Square Tests120 Questions
Exam 13: Analysis of Variance58 Questions
Exam 14: Regression Analysis140 Questions
Exam 15: Inference With Regression Models124 Questions
Exam 16: Regression Models for Nonlinear Relationships115 Questions
Exam 17: Regression Models With Dummy Variables114 Questions
Exam 18: Time Series and Forecasting124 Questions
Exam 19: Returns, Index Numbers and Inflation120 Questions
Exam 20: Nonparametric Tests108 Questions
Select questions type
The _______ regression model allows us to study how the response variable is influenced by two or more explanatory variables.
(Essay)
4.8/5  (33)
(33)
A researcher analyzes the relationship between amusement park attendance and the price of admission.She estimates the following model:  ,where Attendance is the daily attendance (in 1000s)and Price is the gate price (in $).A portion of the regression results is shown in the accompanying table.
 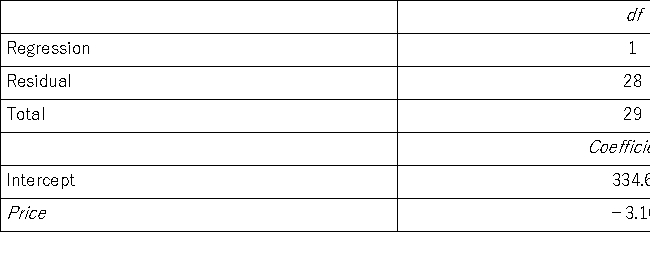 a.Predict the Attendance for an amusement park that charges $80 for admission.
b.Interpret the slope coefficient attached to Price.
c.Calculate the standard error of the estimate.If the sample mean for Attendance is 75.9,what can you infer about the model's predictive power.
d.Calculate and interpret the coefficient of determination.How much of the variability in Attendance is unexplained.
a.Predict the Attendance for an amusement park that charges $80 for admission.
b.Interpret the slope coefficient attached to Price.
c.Calculate the standard error of the estimate.If the sample mean for Attendance is 75.9,what can you infer about the model's predictive power.
d.Calculate and interpret the coefficient of determination.How much of the variability in Attendance is unexplained.
(Essay)
4.8/5 (35)
The actual value y may differ from the expected value E(y).Therefore,we add a ______ ____ term ε to develop a simple linear regression model.
(Essay)
4.9/5 (41)
In the estimation of a multiple regression model with four explanatory variables and 25 observations,SSE = 660 and SST = 1,000.The value of adjusted R2 is the closest to ____.
(Multiple Choice)
4.8/5 (39)
When testing whether the correlation coefficient differs from zero,the value of the test statistic is t20 = 1.95 with a corresponding p-value of 0.0653.At the 5% significance level,can you conclude that the correlation coefficient differs from zero?
(Multiple Choice)
4.9/5 (34)
The positive square root of the coefficient of determination in simple linear regression is always equal to the correlation coefficient.
(True/False)
4.8/5 (34)
The following portion of regression results was obtained when estimating a multiple regression model. 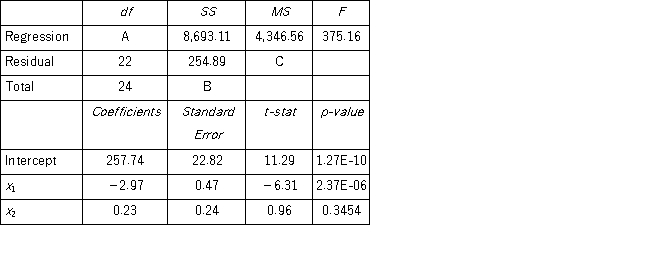 a.What is the sample regression equation?
b.Interpret the slope coefficient for x1.
c.Find the predicted value for y if x1 equals 25 and x2 equals 50.
d.Fill in the missing values in the ANOVA table.
e.Calculate the standard error of the estimate.f.Calculate R2.
a.What is the sample regression equation?
b.Interpret the slope coefficient for x1.
c.Find the predicted value for y if x1 equals 25 and x2 equals 50.
d.Fill in the missing values in the ANOVA table.
e.Calculate the standard error of the estimate.f.Calculate R2.
(Essay)
4.8/5 (44)
The value 0.75 of a sample correlation coefficient indicates a stronger linear relationship than that of 0.60.
(True/False)
4.8/5 (37)
A correlation coefficient r = −0.85 could indicate a _______________________________.
(Multiple Choice)
4.7/5 (34)
Consider the following data:  = 20,sx = 2,
  = -5,sy = 4,and b1 = 0.40.The sample correlation coefficient,rxy is equal to ____.
(Multiple Choice)
4.8/5 (30)
An marketing analyst wants to examine the relationship between sales (in $1,000s)and advertising (in $100s)for firms in the food and beverage industry and collects monthly data for 25 firms.He estimates the model: Sales = β0 +β1 Advertising + ε.The following ANOVA table below shows a portion of the regression results.  Which of the following is the standard error of the estimate?
(Multiple Choice)
4.9/5 (32)
The following data for five years of the annual returns for two of Vanguard's mutual funds,the Vanguard Energy Fund (x)and the Vanguard Healthcare Fund (y),were given as sx = 35.77,sy = 13.34,sxy = 447.68.The competing hypotheses are 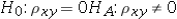 .At the 5% significance level which of the following is the correct conclusion to the test?
(Multiple Choice)
4.9/5 (37)
Over the past 30 years,the sample standard deviations of the rates of return for stock X and Stock Y were 0.20 and 0.12,respectively.The sample covariance between the returns of X and Y is 0.0096.To determine whether the correlation coefficient is significantly different from zero,the appropriate hypotheses are: ____________.
(Multiple Choice)
4.8/5 (36)
Simple linear regression analysis differs from multiple regression analysis in that ___________________________________________________________.
(Multiple Choice)
5.0/5 (25)
A statistics student is asked to estimate y = β0 + β1x + ε.She calculates the following values: 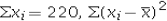 = 440,
  ,
, 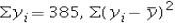 = 1,120,n = 11.Which of the following is the value of y if x equals 2?
(Multiple Choice)
4.8/5 (39)
When estimating a multiple regression model,the following portion of output is obtained: 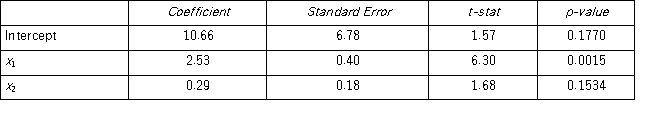 a.What is the sample regression equation?
b.Interpret the slope coefficient for x1.
c.Find the predicted value for y if x1 equals 22 and x2 equals 41.
a.What is the sample regression equation?
b.Interpret the slope coefficient for x1.
c.Find the predicted value for y if x1 equals 22 and x2 equals 41.
(Essay)
4.9/5 (31)
Which of the following is the relationship between the slope and correlation coefficient?
(Multiple Choice)
4.7/5 (38)
An marketing analyst wants to examine the relationship between sales (in $1,000s)and advertising (in $100s)for firms in the food and beverage industry and collects monthly data for 25 firms.He estimates the model: Sales= β0 +β1 Advertising + ε.The following ANOVA table below shows a portion of the regression results. 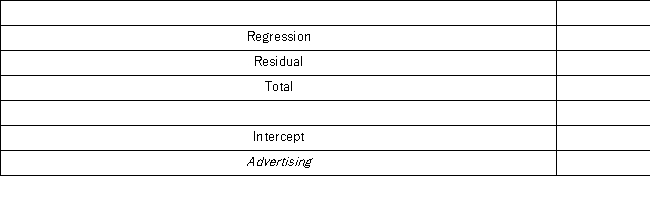 Which of the following is the prediction of Sales for a firm with Advertising of $500?
(Multiple Choice)
4.9/5 (35)
Consider the following sample regression equation  = 200 + 10x,where y is the supply for Product A (in 1000s)(in 1,000s)and x is the price of Product A (in $).If the price of Product A is $5,then we expect supply to be _____.
(Multiple Choice)
4.7/5 (34)
Costco sells paperback books in their retail stores and wanted to examine the relationship between price and demand.The price of a particular novel was adjusted each week and the weekly sales were recorded in the following table. 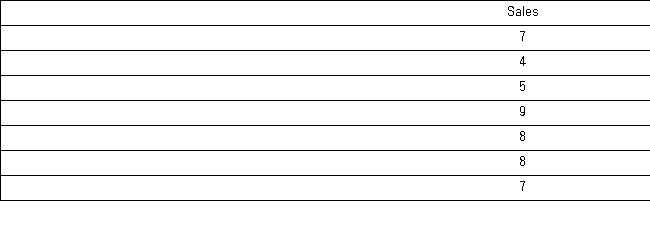 Management would like to use simple regression analysis to estimate weekly demand for this novel using the price of the novel.The average weekly sales for the novel when priced at $10 is equal to ________.
(Multiple Choice)
4.9/5 (45)
Filters
- Essay(0)
- Multiple Choice(0)
- Short Answer(0)
- True False(0)
- Matching(0)