Exam 14: Regression Analysis
Exam 1: Statistics and Data100 Questions
Exam 2: Tabular and Graphical Methods123 Questions
Exam 3: Numerical Descriptive Measures151 Questions
Exam 4: Basic Probability Concepts116 Questions
Exam 5: Discrete Probability Distributions139 Questions
Exam 6: Continuous Probability Distributions128 Questions
Exam 7: Sampling and Sampling Distributions124 Questions
Exam 8: Interval Estimation123 Questions
Exam 9: Hypothesis Testing135 Questions
Exam 10: Statistical Inference Concerning Two Populations124 Questions
Exam 11: Statistical Inference Concerning Variance111 Questions
Exam 12: Chi-Square Tests120 Questions
Exam 13: Analysis of Variance58 Questions
Exam 14: Regression Analysis140 Questions
Exam 15: Inference With Regression Models124 Questions
Exam 16: Regression Models for Nonlinear Relationships115 Questions
Exam 17: Regression Models With Dummy Variables114 Questions
Exam 18: Time Series and Forecasting124 Questions
Exam 19: Returns, Index Numbers and Inflation120 Questions
Exam 20: Nonparametric Tests108 Questions
Select questions type
The value −0.75 of a sample correlation coefficient indicates a stronger linear relationship than that of 0.60.
(True/False)
4.8/5  (28)
(28)
Consider the following sample regression equation  = 150 - 20x,where y is the demand for Product A (in 1,000s)and x is the price of the product (in $).If the price of the good increases by $3,then we expect demand for Product A to ______________.
(Multiple Choice)
4.7/5 (40)
Another name for an explanatory variable is the dependent variable.
(True/False)
5.0/5 (39)
Consider the following sample data: 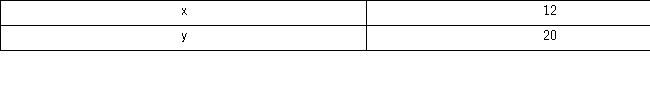 a.Construct a scatterplot and verify that estimating a simple linear regression is appropriate.
b.Calculate b0 and b1.What is the sample regression equation? Predict y if x equals 15.
c.Interpret the value of the slope coefficient,b1.
d.Calculate
a.Construct a scatterplot and verify that estimating a simple linear regression is appropriate.
b.Calculate b0 and b1.What is the sample regression equation? Predict y if x equals 15.
c.Interpret the value of the slope coefficient,b1.
d.Calculate  and se.
e.Calculate R2.
and se.
e.Calculate R2.
(Essay)
4.8/5 (29)
An real estate analyst believes that the three main factors that influence an apartment's rent in a college town are the number of bedrooms,the number of bathrooms,and the apartment's square footage.For 40 apartments,she collects data on the rent (y,in $),the number of bedrooms (x1),the number of bathrooms (x2),and its square footage (x3).She estimates the following model as Rent = β0 + β1 Bedroom + β2 Bath + β3 Sqft + ε.The following ANOVA table shows a portion of the regression results. 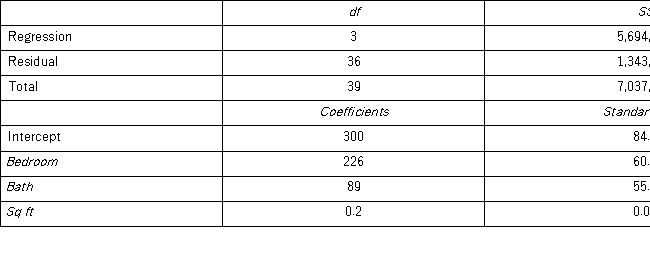 The standard deviation of the difference between actual rent and the estimate of rent is ____.
(Multiple Choice)
4.8/5 (38)
An real estate analyst believes that the three main factors that influence an apartment's rent in a college town are the number of bedrooms,the number of bathrooms,and the apartment's square footage.For 40 apartments,she collects data on the rent (y,in $),the number of bedrooms (x1),the number of bathrooms (x2),and its square footage (x3).She estimates the following model as Rent = β0 + β1 Bedroom + β2 Bath + β3 Sqft + ε.The following ANOVA table shows a portion of the regression results.  Which of the following would be the rent for a 1,000-square-foot apartment that has two bedrooms and two bathrooms?
(Multiple Choice)
4.8/5 (33)
When estimating  = β0 + β1x1 + β2x2 +ε,the following regression results using ANOVA were obtained.
 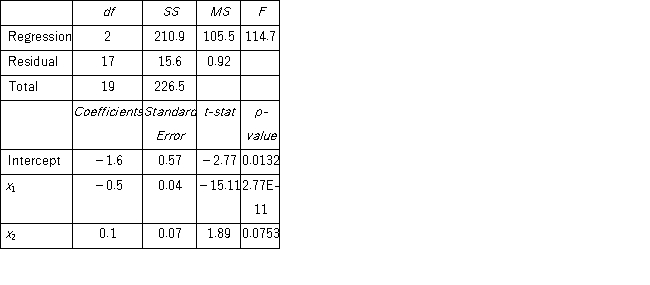 Which of the following is the coefficient of determination?
(Multiple Choice)
4.9/5 (39)
The capital asset pricing model is given by R - RF = α + β(RM - Rf)+ ε,where RM = expected return on the market,Rf = risk-free market return,and R = expected return on a stock or portfolio of interest.The explanatory variable in this model is _________.
(Multiple Choice)
4.8/5 (37)
Costco sells paperback books in their retail stores and wanted to examine the relationship between price and demand.The price of a particular novel was adjusted each week and the weekly sales were recorded in the following table. 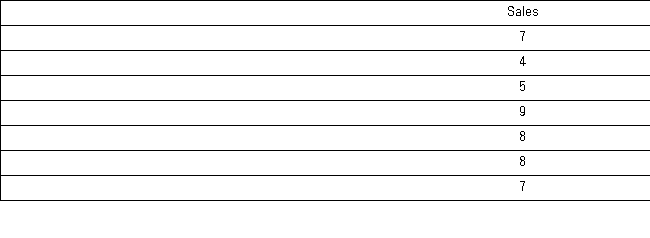 Management would like to use simple regression analysis to estimate weekly demand for this novel using the price of the novel.The error sum of squares for this sample is equal to ________.
(Multiple Choice)
4.9/5 (37)
The following table shows the number of cars sold last month by six dealers at Centreville Nissan dealership and their number of years of sales experience.  Management would like to use simple regression analysis to estimate monthly car sales using the number of years of sales experience.The coefficient of determination for this sample is equal to _______.
(Multiple Choice)
4.8/5 (34)
A statistics student is asked to estimate y = β0 + β1x + ε.She calculates the following values: 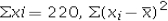 = 440,
  ,
,  = 1,120,n = 11.The value of the slope b1 is ____.
(Multiple Choice)
4.9/5 (22)
A manager at a local bank analyzed the relationship between monthly salary (y,in $)and length of service (x,measured in months)for 30 employees.She estimates the model: Salary = β0 +β1 Advertising + ε.The following ANOVA table below shows a portion of the regression results.  How much of the variation in Salary is unexplained by the model?
(Multiple Choice)
4.8/5 (34)
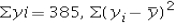
Data was collected for 30 professional tennis players regarding their performance in Grand Slams (the four major tennis tournaments in the world).The response variable Win,expressed as a proportion ranging from 0 to 1,is believed to depend on two explanatory variables: the percentage of the Double Faults and the number of Aces.The following model is estimated:  .A portion of the regression results is shown in the accompanying table.
 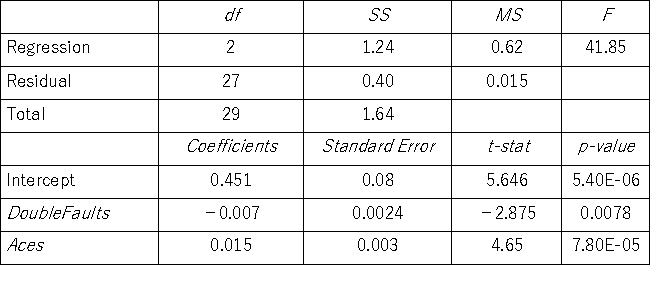 a.Predict the winning percentage for a player who had 20 double faults and five aces.
b.Interpret the slope coefficient attached to DoubleFaults.
c.Calculate the standard error of the estimate.If the sample mean for Win is 0.50,what can you infer about the model's predictive power?.
d.Calculate and interpret the coefficient of determination.
e.Calculate the adjusted R2.
a.Predict the winning percentage for a player who had 20 double faults and five aces.
b.Interpret the slope coefficient attached to DoubleFaults.
c.Calculate the standard error of the estimate.If the sample mean for Win is 0.50,what can you infer about the model's predictive power?.
d.Calculate and interpret the coefficient of determination.
e.Calculate the adjusted R2.
(Essay)
4.9/5 (33)
A manager at a ski resort in Vermont wanted to determine the effect that weather had on its sales of lift tickets.The manager of the resort collected data over the last 20 years on the number of lift tickets sold during Christmas week (y),the total snowfalls in inches (x1),and the average temperature in degrees Fahrenheit (x2).The following model is estimated:  .A portion of the regression results is shown in the accompanying table.
 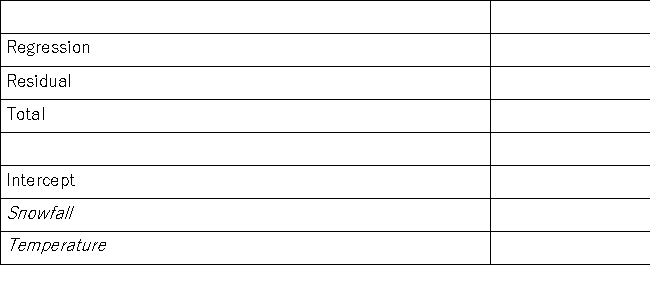 a.Predict the number of lift tickets sold if during Christmas week,the total snowfall was 25 inches and the average temperature was 35 degrees Fahrenheit.
b.Interpret the slope coefficient attached to Snowfall.
c.Calculate the standard deviation of the difference between the actual number of tickets sold and the estimate of the number of tickets sold.
d.Calculate and interpret the coefficient of determination.
e.Calculate the adjusted R2.
a.Predict the number of lift tickets sold if during Christmas week,the total snowfall was 25 inches and the average temperature was 35 degrees Fahrenheit.
b.Interpret the slope coefficient attached to Snowfall.
c.Calculate the standard deviation of the difference between the actual number of tickets sold and the estimate of the number of tickets sold.
d.Calculate and interpret the coefficient of determination.
e.Calculate the adjusted R2.
(Essay)
4.8/5 (37)
A manager at a local bank analyzed the relationship between monthly salary (y,in $)and length of service (x,measured in months)for 30 employees.She estimates the model: Salary = β0 +β1 Advertising + ε.The following ANOVA table below shows a portion of the regression results. 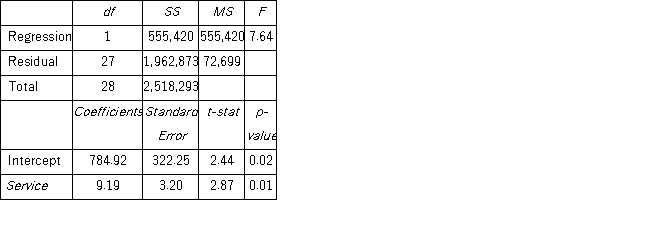 The coefficient of determination indicates that __________.
(Multiple Choice)
5.0/5 (41)
John is an undergraduate business major studying at a local university.He wonders how his grade point average (GPA)can affect his future earnings.He asks five recent business school graduates information on their GPA and income (in $1,000s).The following table shows this information. 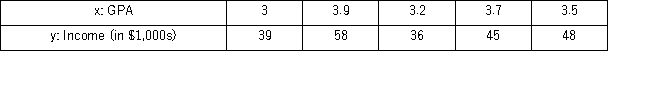 a.Construct a scatterplot and verify that estimating a simple linear regression is appropriate in this case.
b.Calculate b0 and b1.What is the sample regression equation?
c.Interpret the coefficient for GPA.
d.Find the predicted income earned if a GPA equals 3.0,3.3,and 3.6.
a.Construct a scatterplot and verify that estimating a simple linear regression is appropriate in this case.
b.Calculate b0 and b1.What is the sample regression equation?
c.Interpret the coefficient for GPA.
d.Find the predicted income earned if a GPA equals 3.0,3.3,and 3.6.
(Essay)
4.8/5 (34)
The standard error of the estimate measures ______________.
(Multiple Choice)
4.8/5 (41)
A sociologist examines the relationship between the poverty rate and several socioeconomic factors.For the 50 states and the District of Columbia (n = 51),he collects data on the poverty rate (y,in %),the percent of the population with at least a high school education (x1),median income (x2,in $1000s),and the mortality rate per 1,000 residents (x3).He estimates the following model as y = β0 + β1 Education + β2 Income + β3 Mortality + ε.The following ANOVA table shows a portion of the regression results. 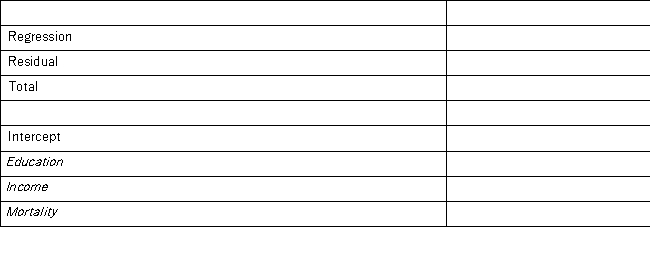 The coefficient of determination indicates that __________.
(Multiple Choice)
4.9/5 (36)
Filters
- Essay(0)
- Multiple Choice(0)
- Short Answer(0)
- True False(0)
- Matching(0)