Exam 13: Computer Simulation With Analytic Solver
Exam 1: Introduction54 Questions
Exam 2: Linear Programming: Basic Concepts85 Questions
Exam 3: Linear Programming: Formulation and Applications76 Questions
Exam 4: The Art of Modeling With Spreadsheets75 Questions
Exam 5: What-If Analysis for Linear Programming75 Questions
Exam 6: Network Optimization Problems84 Questions
Exam 7: Using Binary Integer Programming to Deal With Yes-Or-No Decisions76 Questions
Exam 8: Nonlinear Programming75 Questions
Exam 9: Decision Analysis80 Questions
Exam 10: Forecasting77 Questions
Exam 11: Queueing Models78 Questions
Exam 12: Computer Simulation: Basic Concepts79 Questions
Exam 13: Computer Simulation With Analytic Solver77 Questions
Select questions type
A trend chart shows the trend in profit values from trial to trial.
Free
(True/False)
4.8/5  (25)
(25)
Correct Answer: Verified
False
Which of the following is not a characteristic of the normal distribution?
Free
(Multiple Choice)
4.9/5 (39)
Correct Answer:Verified
D
Which of the following is not one of the charts or tables provided by RSPE?
Free
(Multiple Choice)
4.9/5 (36)
Correct Answer:Verified
C
A probability distribution shows the relative likelihood of observing any particular value.
(True/False)
4.9/5 (28)
The sensitivity chart in RSPE indicates the increase in the results cell per unit increase in the uncertain variable cell.
(True/False)
4.7/5 (43)
RSPE is guaranteed to find the optimal solution to a simulation problem.
(True/False)
4.8/5 (27)
One way to ensure that Analytic Solver identifies an optimal solution quickly is to do which of the following?
I. Set the "Max Time without Improvement" setting to zero.
II. Add bounds for the decision variables.
III. Add integer constraints to the model.
(Multiple Choice)
4.7/5 (29)
When applying simulation to an inventory problem, which of the following would be an uncertain variable cell?
(Multiple Choice)
4.8/5 (29)
A danger of using the lognormal distribution is that values can fall below zero.
(True/False)
4.9/5 (32)
The negative binomial distribution describes the number of trials until an event occurs n times.
(True/False)
4.9/5 (37)
The geometric distribution describes the number of times an event occurs in a fixed number of trials.
(True/False)
4.7/5 (37)
The distribution shown below is most likely which of the following? 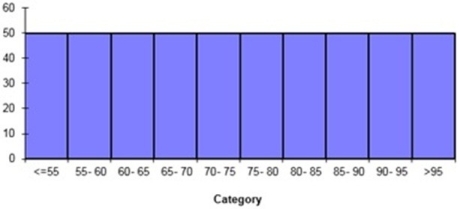
(Multiple Choice)
4.9/5 (37)
The exponential distribution has a most likely value that is equal to
(Multiple Choice)
4.7/5 (40)
A grocery chain has decided to reduce the price of milk to encourage customers to purchase higher quantities. This is an example of revenue management.
(True/False)
4.7/5 (34)
Which of the following is not a characteristic of the lognormal distribution?
(Multiple Choice)
4.7/5 (30)
Increasing the number of trials increases the accuracy of a simulation.
(True/False)
4.9/5 (32)
A danger of using the normal distribution is that values can fall below zero.
(True/False)
4.9/5 (30)
Which of the following distributions is widely used to describe the time between random events?
(Multiple Choice)
4.9/5 (40)
Filters
- Essay(0)
- Multiple Choice(0)
- Short Answer(0)
- True False(0)
- Matching(0)