Exam 13: Computer Simulation With Analytic Solver
Exam 1: Introduction54 Questions
Exam 2: Linear Programming: Basic Concepts85 Questions
Exam 3: Linear Programming: Formulation and Applications76 Questions
Exam 4: The Art of Modeling With Spreadsheets75 Questions
Exam 5: What-If Analysis for Linear Programming75 Questions
Exam 6: Network Optimization Problems84 Questions
Exam 7: Using Binary Integer Programming to Deal With Yes-Or-No Decisions76 Questions
Exam 8: Nonlinear Programming75 Questions
Exam 9: Decision Analysis80 Questions
Exam 10: Forecasting77 Questions
Exam 11: Queueing Models78 Questions
Exam 12: Computer Simulation: Basic Concepts79 Questions
Exam 13: Computer Simulation With Analytic Solver77 Questions
Select questions type
The parameter analysis report in RSPE can be used to systematically investigate a set of values for a decision variable in a simulation model.
(True/False)
4.8/5  (29)
(29)
The distribution shown below is most likely which of the following? 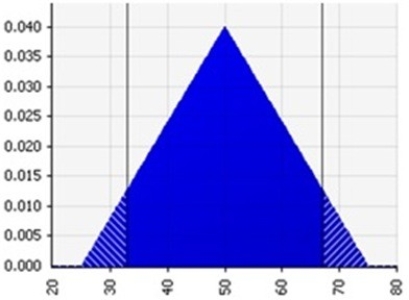
(Multiple Choice)
4.7/5 (39)
The more trials that are run, the lower the standard error will become.
(True/False)
4.8/5 (29)
The distribution shown below is most likely which of the following? 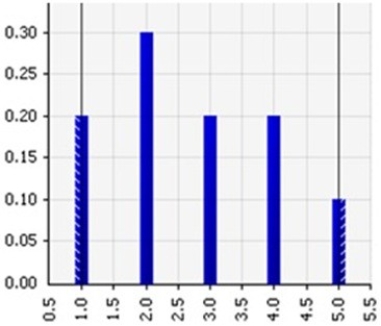
(Multiple Choice)
4.8/5 (38)
The sensitivity chart in RSPE indicates how strongly various uncertain variable cells influence the results cell.
(True/False)
4.8/5 (37)
The ride sharing firm Uber uses dynamic pricing, which results in higher fares during busy times and lower fares during less busy times. This is an example of revenue management.
(True/False)
4.9/5 (31)
The relative likelihood of any particular value is given by the height of the distribution's
(Multiple Choice)
4.7/5 (33)
A manager has observed sales for a number of days and developed the following table of probabilities. Which of the following distributions would be most appropriate for modeling the daily sales?
Daily Sales Probability 100 0.40 200 0.05 300 0.50 400 0.05
(Multiple Choice)
4.9/5 (33)
For a distribution that is positively skewed, which of the following is TRUE?
(Multiple Choice)
4.9/5 (37)
Which chart indicates the trend in forecast values as a particular decision variable is varied?
(Multiple Choice)
4.8/5 (24)
Which of the following is not a step required to perform a simulation with RSPE?
(Multiple Choice)
4.8/5 (29)
The parameter analysis report can simultaneously vary up to how many different decision variables?
(Multiple Choice)
4.8/5 (44)
Which of the following are advantages of computer simulation over analytical methods like PERT/CPM for predicting the probability that a project will complete by a deadline?
I. It does not need to make as many simplifying assumptions.
II. It is more flexible about which probability distributions can be used.
III. It provides a solution more quickly.
(Multiple Choice)
5.0/5 (34)
The standard error gives an indication of the accuracy of the estimated mean.
(True/False)
4.9/5 (43)
A distribution is chosen from the Distributions menu for which type of cell?
(Multiple Choice)
4.9/5 (27)
The normal distribution is popular because it accurately portrays the variation observed in natural phenomenon.
(True/False)
4.9/5 (33)
The normal distribution is a good choice to represent the task durations in a project management problem.
(True/False)
4.9/5 (37)
Filters
- Essay(0)
- Multiple Choice(0)
- Short Answer(0)
- True False(0)
- Matching(0)